Fig. 7
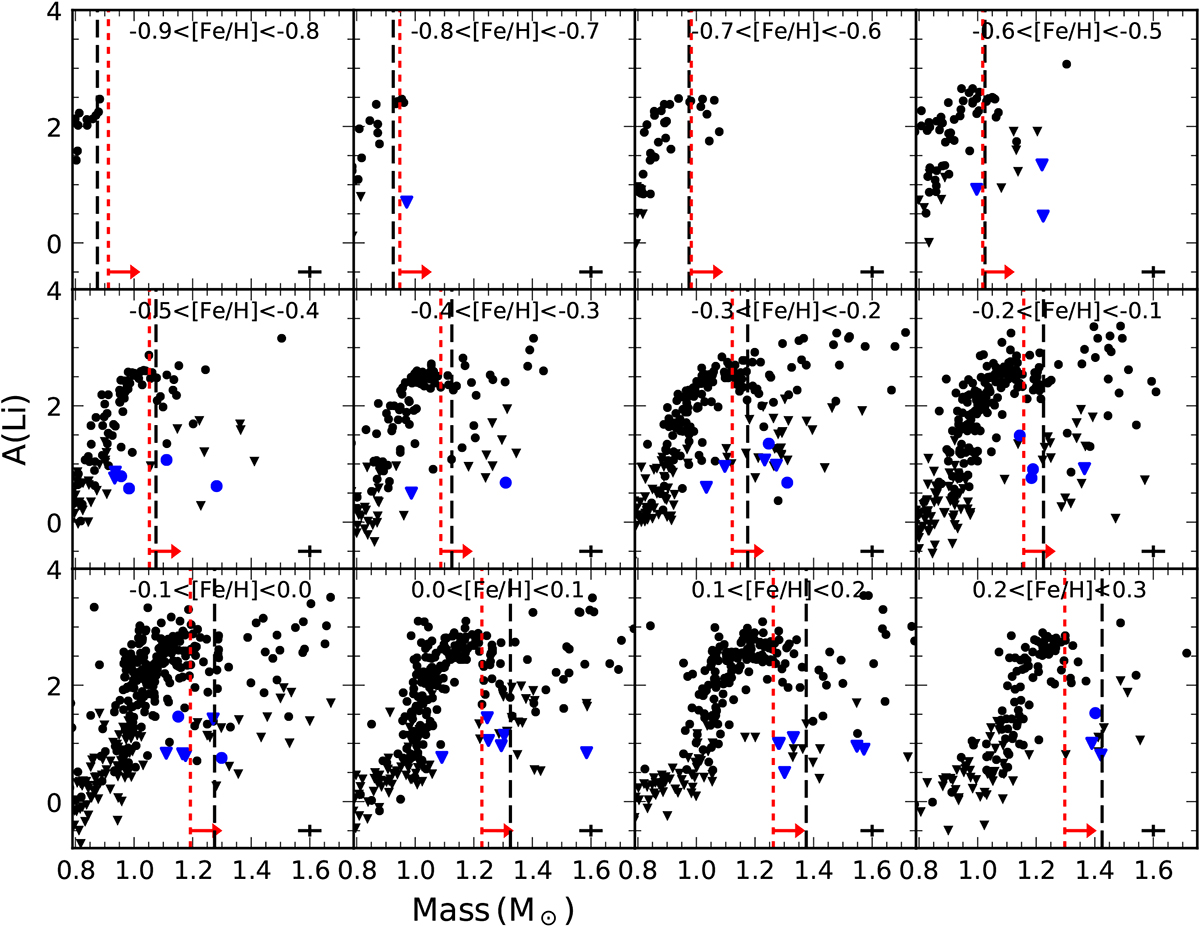
Li as a function of mass for all stars in the sample, in different metallicity bins, where the blue symbols represent stars located below the Li desert. Downward triangles are Li upper limits. Each panel shows the location of the center of the Li dip (dashed black line) and the cooler side (red dotted line) based on a fit obtained by the analysis of clusters by Balachandran (1995) and Cummings et al. (2012), respectively. As in previous figures, circles are Li determinations and triangles are upper limits.
Current usage metrics show cumulative count of Article Views (full-text article views including HTML views, PDF and ePub downloads, according to the available data) and Abstracts Views on Vision4Press platform.
Data correspond to usage on the plateform after 2015. The current usage metrics is available 48-96 hours after online publication and is updated daily on week days.
Initial download of the metrics may take a while.