Fig. 1
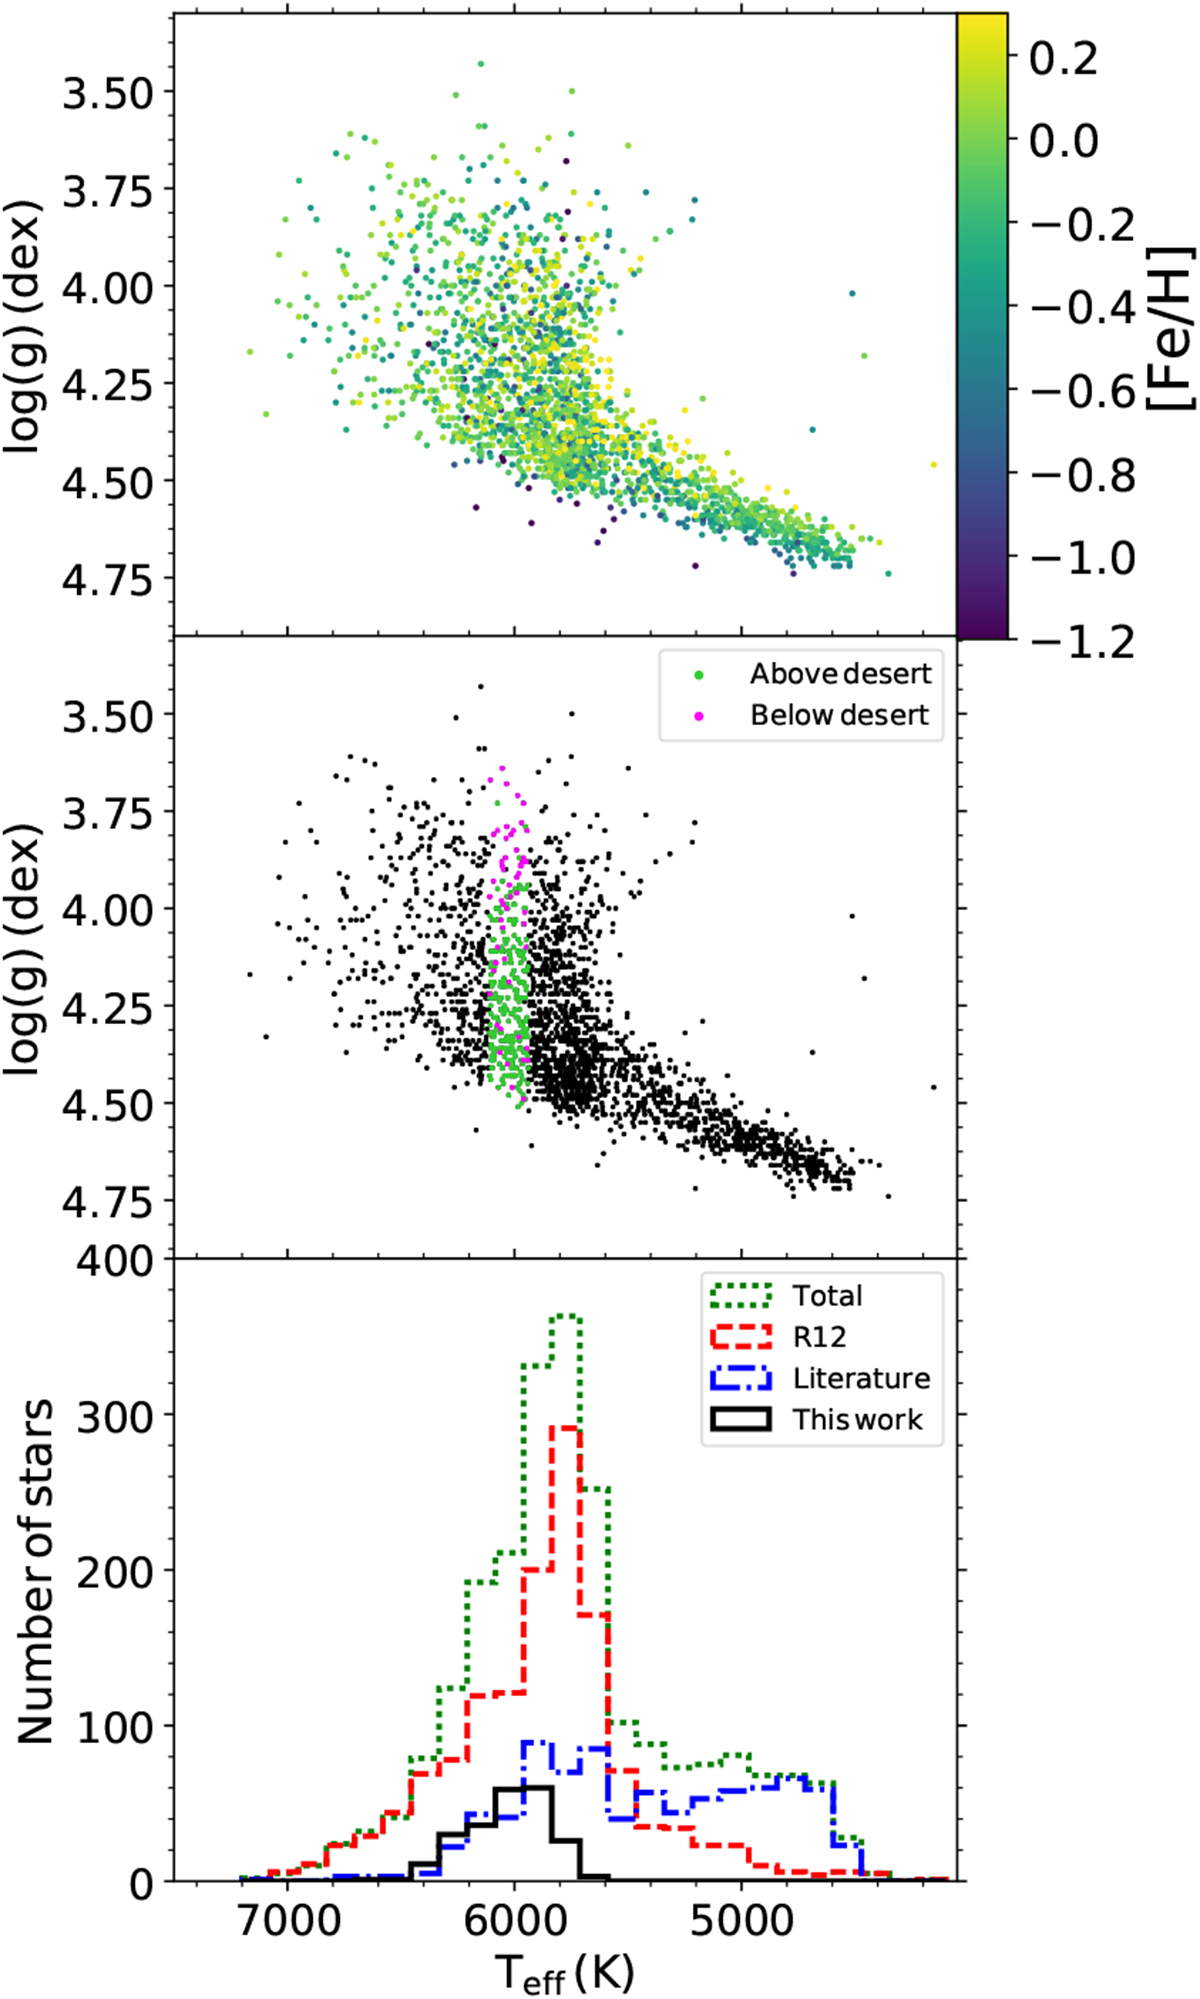
Top panel and middle panel: stars of the sample in the Teff–log g plane. Stars in the top panel are color-coded by their metallicities, and in the middle panel, stars in the effective temperature region of the Li desert are color-coded according to their Li abundance. Bottom panel: temperature distribution of the final catalog compared to the compilation of Ramírez et al. (2012), the largest sample with measured stellar ages and masses so far (R12), the new literature data obtained from Delgado Mena et al. (2014); Gonzalez (2014); Delgado Mena et al. (2015) and Gonzalez (2015) (Literature) and the new measurements provided by this work (This work). We note that, while few in relative terms, the new measurements reported in this work span, by design, the temperature region of the Li desert.
Current usage metrics show cumulative count of Article Views (full-text article views including HTML views, PDF and ePub downloads, according to the available data) and Abstracts Views on Vision4Press platform.
Data correspond to usage on the plateform after 2015. The current usage metrics is available 48-96 hours after online publication and is updated daily on week days.
Initial download of the metrics may take a while.