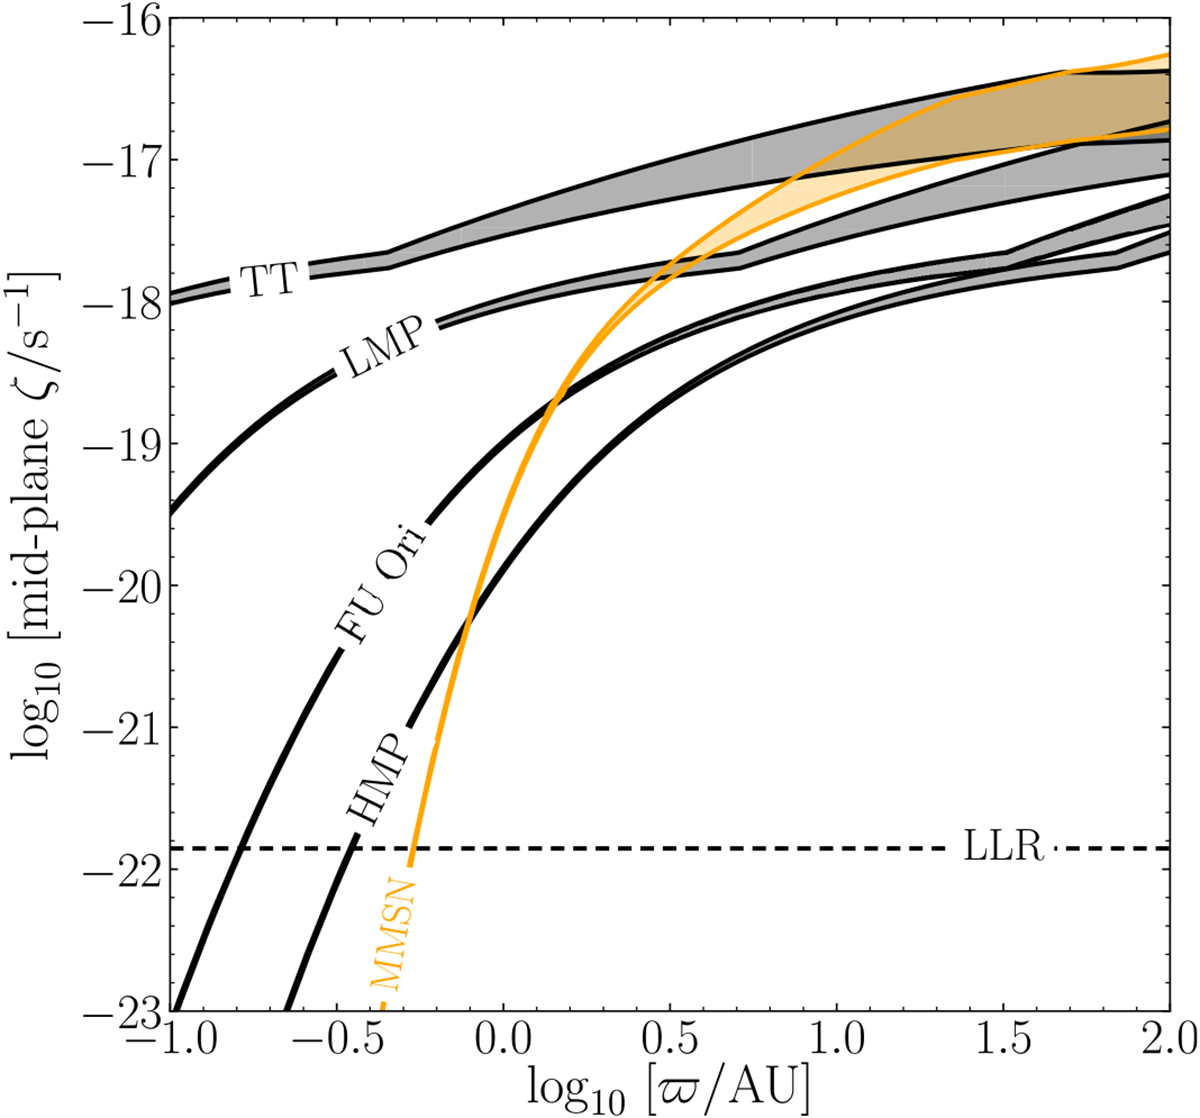
Fig. 9

Mid-plane CR ionisation rate per H2,
ζ, plotted against radius ϖ
in the TT, LMP, FU Ori, and HMP models from Shu et al. (2007) together with the standard (unmagnetised) MMSN model from Hayashi (1981). The upper and lower borders of the shaded areas correspond to the unmodulated Galactic CR spectra
![]() and
and ![]() , respectively. The kinks seen at the level of ζ ≈ 2 × 10⁻¹⁸ s−1
occur at the transition surface density Σtr = 130 g cm−2
in Eq. (46). The horizontal dotted line at 1.4 × 10⁻²² s−1
shows the value of the ionisation rate set by LLR.
, respectively. The kinks seen at the level of ζ ≈ 2 × 10⁻¹⁸ s−1
occur at the transition surface density Σtr = 130 g cm−2
in Eq. (46). The horizontal dotted line at 1.4 × 10⁻²² s−1
shows the value of the ionisation rate set by LLR.
Current usage metrics show cumulative count of Article Views (full-text article views including HTML views, PDF and ePub downloads, according to the available data) and Abstracts Views on Vision4Press platform.
Data correspond to usage on the plateform after 2015. The current usage metrics is available 48-96 hours after online publication and is updated daily on week days.
Initial download of the metrics may take a while.


