Fig. 8
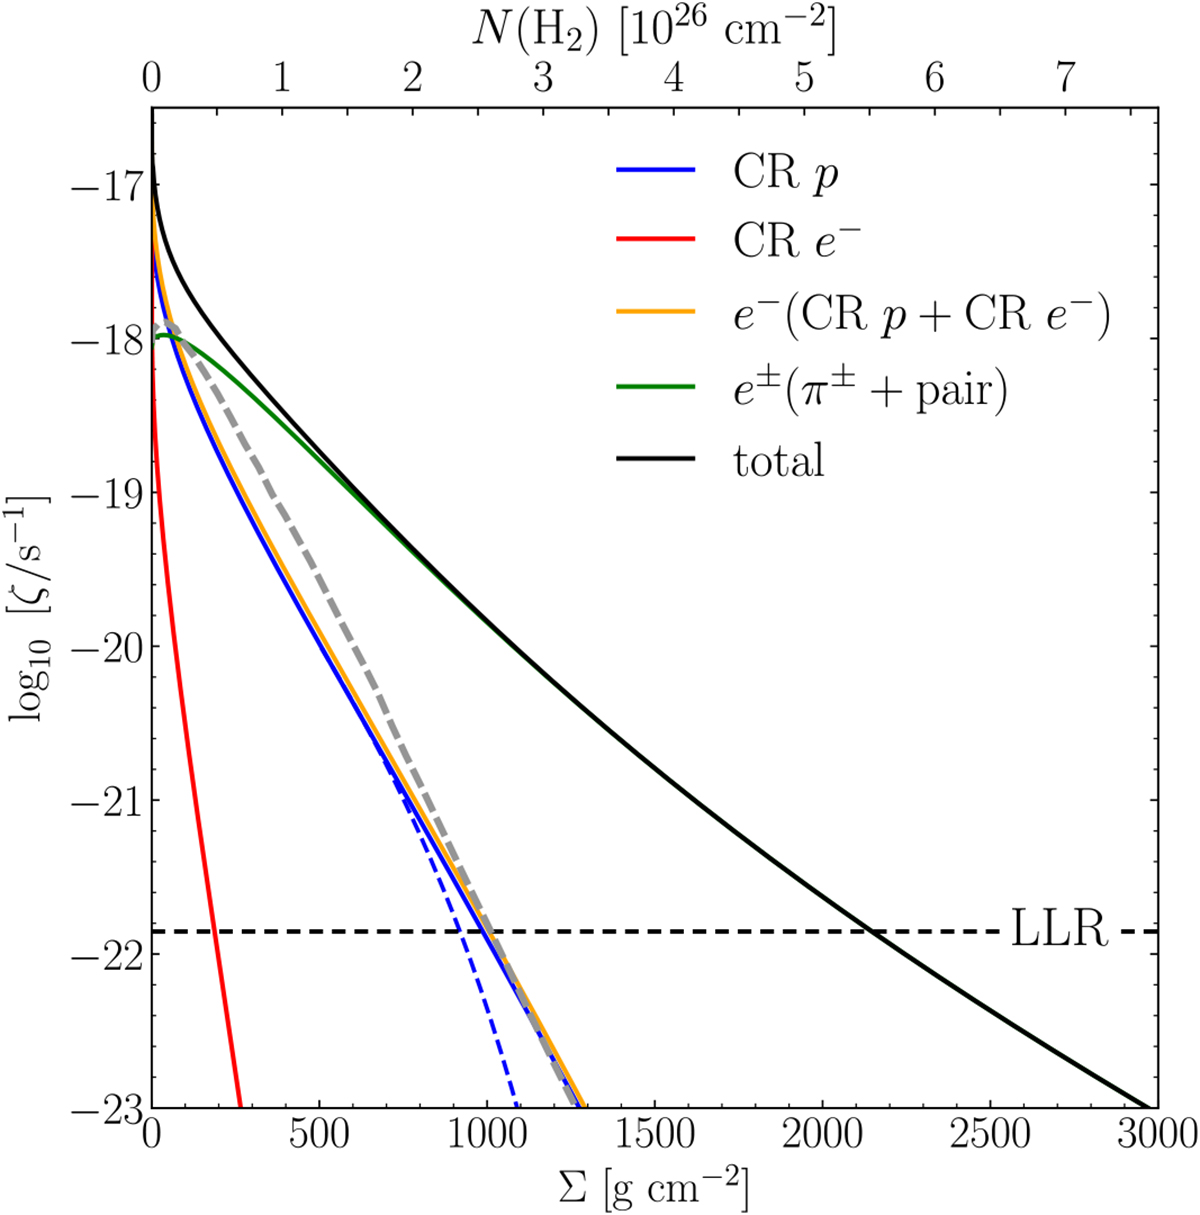
Ionisation rate per H2 due to primary and secondary CR species, ζ, plotted vs. the surface density Σ (bottom scale) and the column density N (top scale). The black line shows the total ionisation rate. Partial contributions to ζ include ionisation due to primary CR protons and electrons (blue and red lines, respectively), ionisation due to secondary electrons created by primary CRs (orange line), and ionisation due to electrons and positrons created by charged pion decay and pair production (green line). The blue dashed line shows the proton contribution calculated with the CSDA approach. The horizontal dashed line at 1.4 × 10⁻²² s−1 indicates the total ionisation rate set by long-lived radioactive nuclei (LLR). For comparison, we also plot the total ionisation rate per H2 obtained by (Umebayashi & Nakano 1981; grey dashed line). The total rate of the electron production, ζe, is approximately 1.11ζ.
Current usage metrics show cumulative count of Article Views (full-text article views including HTML views, PDF and ePub downloads, according to the available data) and Abstracts Views on Vision4Press platform.
Data correspond to usage on the plateform after 2015. The current usage metrics is available 48-96 hours after online publication and is updated daily on week days.
Initial download of the metrics may take a while.