Fig. 7
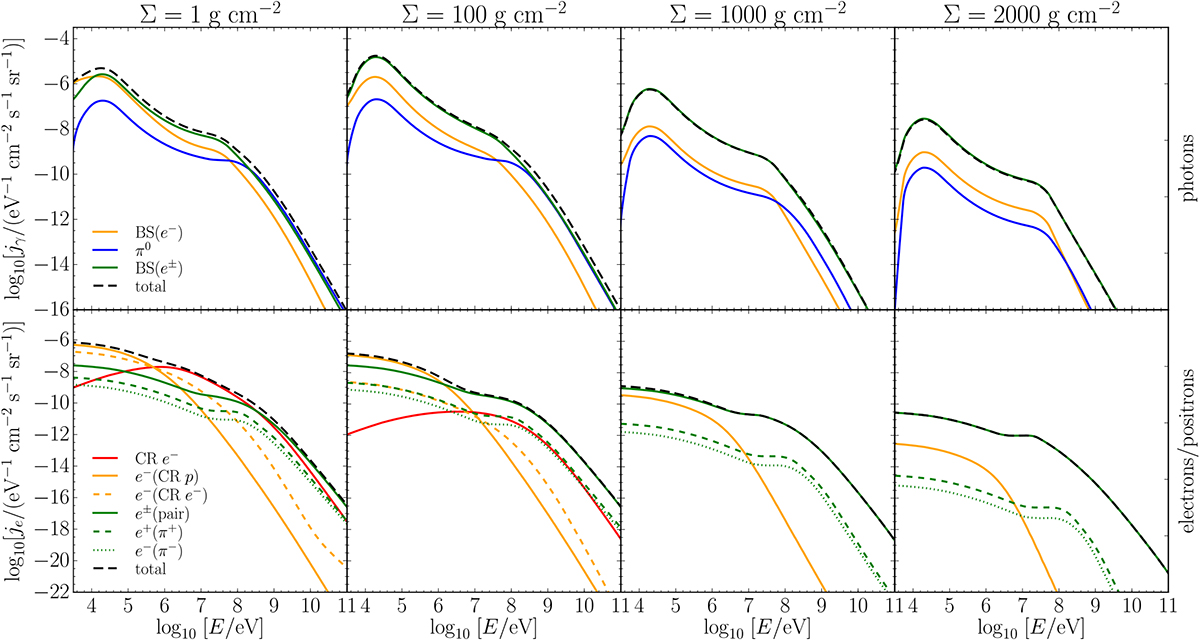
Differential fluxes (energy spectra) jk(E) of photons (upper row) and electrons and positrons (lower row), plotted for four characteristic values of the surface density Σ. Each plot shows partial contributions (coloured lines) to the total differential flux (black dashed line). For photons, the contributions are due to BS from electrons (e−) produced by CRs (orange line) and due to π0 decay (blue line) and BS from electrons and positrons (e±) created by pair production and charged pion decay (green line). For electrons, the contributions are due to CR electrons (solid red line), secondary electrons (e−) produced by CRs (solid and dashed orange lines), and electrons and positrons (e±) generated by pair production (green solid line) and decay of charged pions (dashed and dotted green lines).
Current usage metrics show cumulative count of Article Views (full-text article views including HTML views, PDF and ePub downloads, according to the available data) and Abstracts Views on Vision4Press platform.
Data correspond to usage on the plateform after 2015. The current usage metrics is available 48-96 hours after online publication and is updated daily on week days.
Initial download of the metrics may take a while.