Free Access
Fig. 2
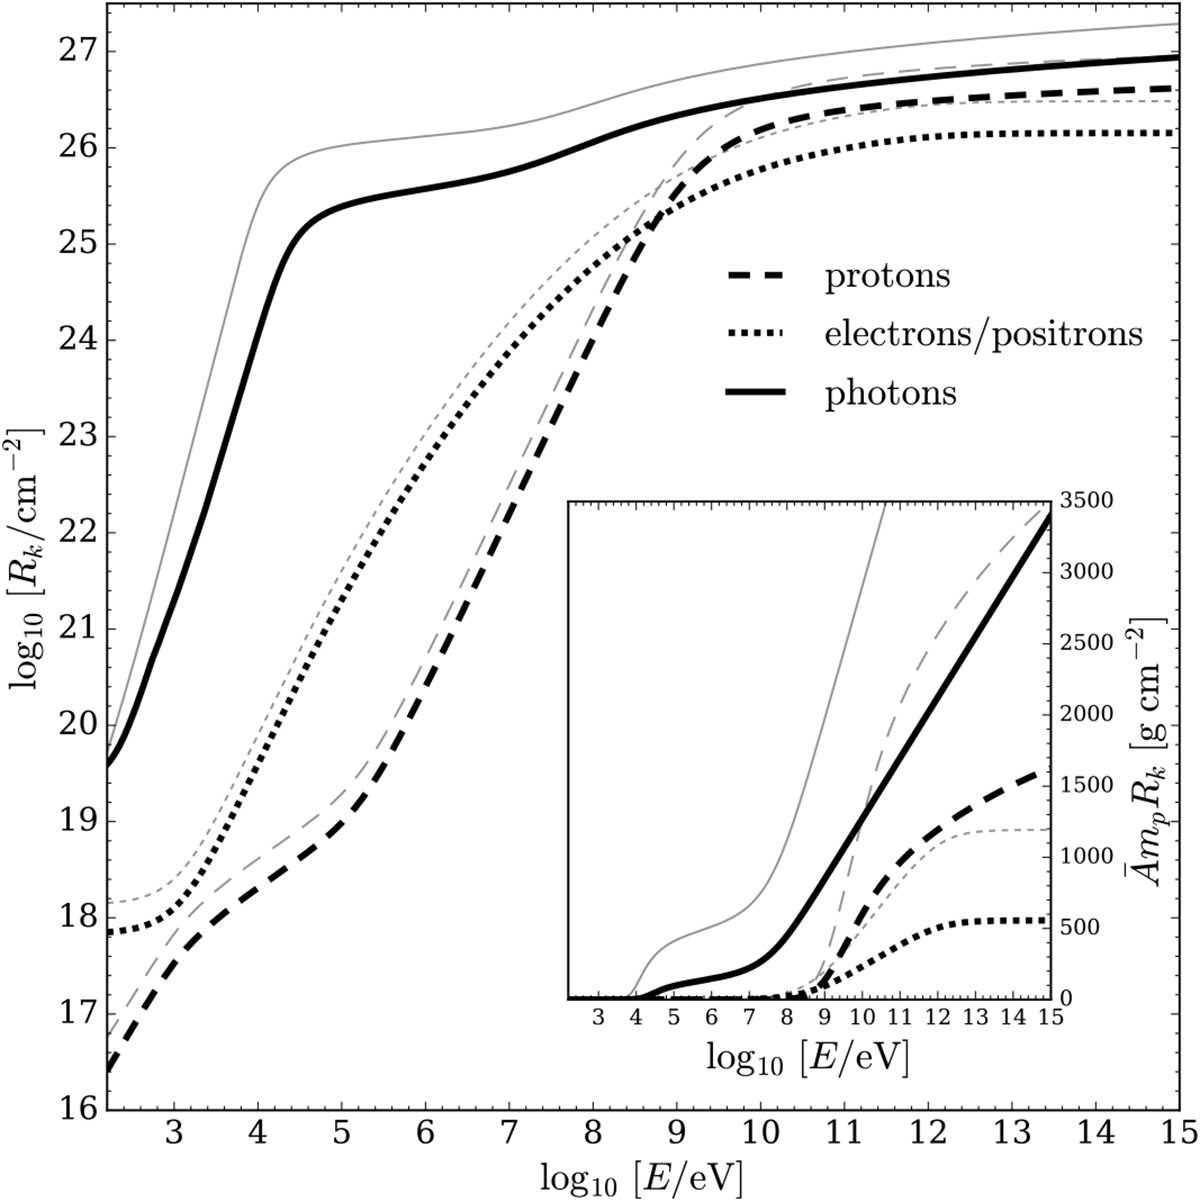
Total range functions, Rk(E), of primary and secondary CR particles (thick black lines), Eq. (9). The inset shows the total range functions multiplied by Āmp, to highlight the behaviour at large surface densities. For comparison, the range functions for atomic hydrogen are also plotted (thin grey lines).
Current usage metrics show cumulative count of Article Views (full-text article views including HTML views, PDF and ePub downloads, according to the available data) and Abstracts Views on Vision4Press platform.
Data correspond to usage on the plateform after 2015. The current usage metrics is available 48-96 hours after online publication and is updated daily on week days.
Initial download of the metrics may take a while.