Fig. 10
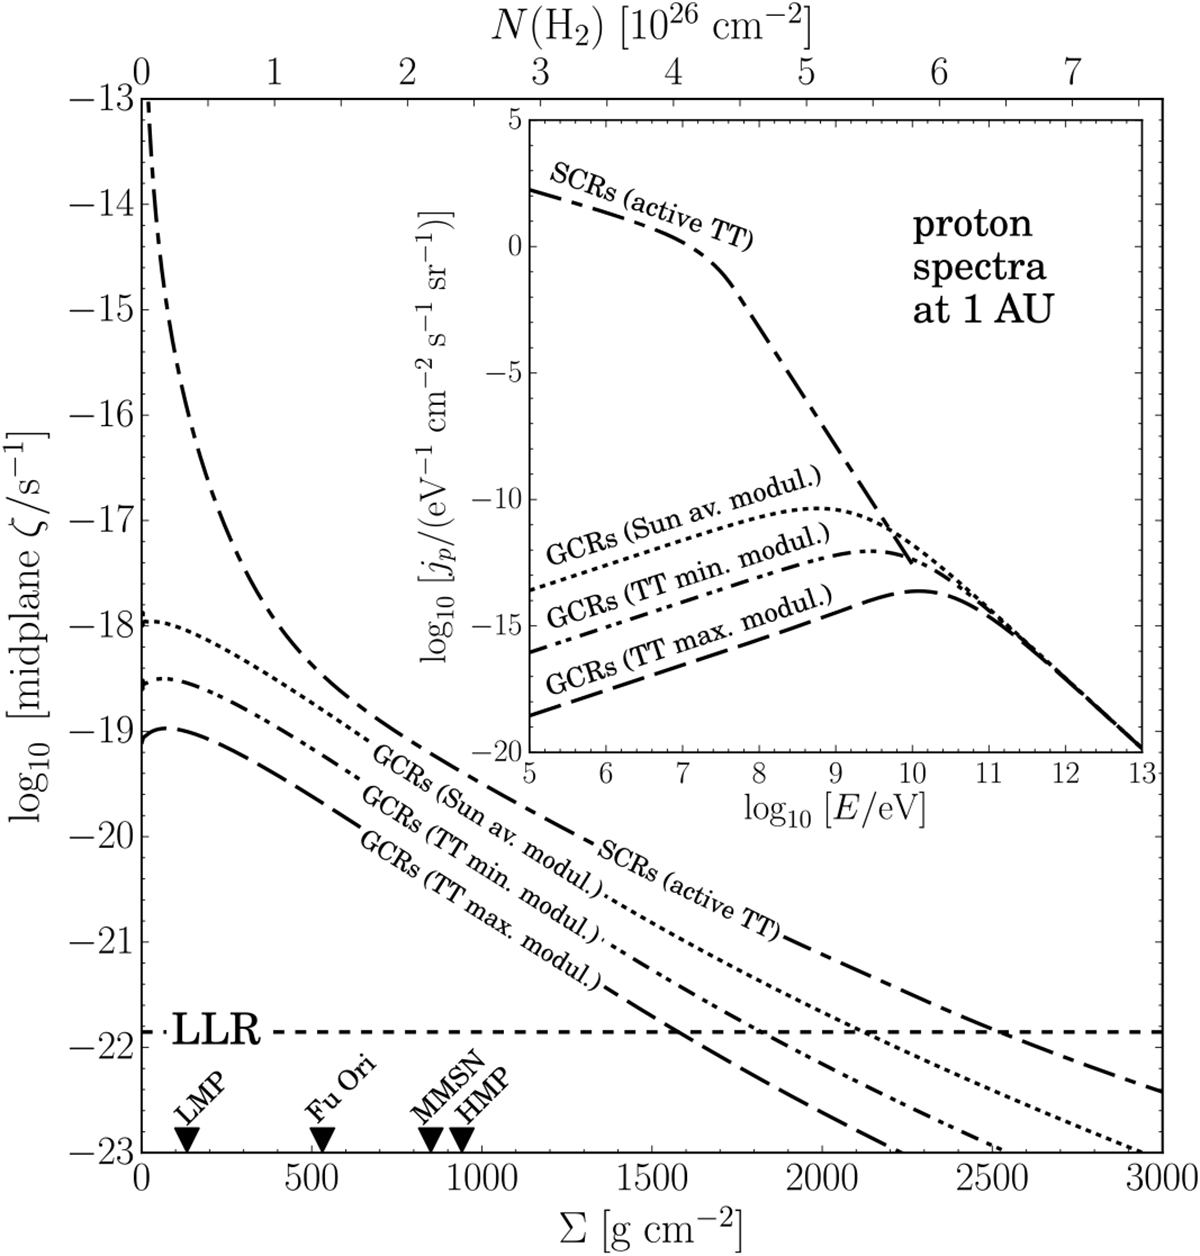
Mid-plane CR ionisation rate per H2, ζ, vs. the surface density Σ (bottom scale) and column density N (top scale) plotted for several proton spectra (at a distance of 1 AU from the central star), as shown in the inset. Galactic CRs with solar mean modulation (dotted line); minimum and maximum modulation by a TT wind (dash-dot-dotted and long dashed line, respectively); and stellar CRs from an active TT star (dash-dotted line). The horizontal dashed line shows the ionisation rate set by LLR. For reference, black triangles on the horizontal axis indicate the values of the mid-plane disc density (Σdisc ∕2) at 1 AU for the LMP, FU Ori, MMSN, and HMP models (134, 532, 850, and 942 g cm−2, respectively).
Current usage metrics show cumulative count of Article Views (full-text article views including HTML views, PDF and ePub downloads, according to the available data) and Abstracts Views on Vision4Press platform.
Data correspond to usage on the plateform after 2015. The current usage metrics is available 48-96 hours after online publication and is updated daily on week days.
Initial download of the metrics may take a while.