Fig. 5
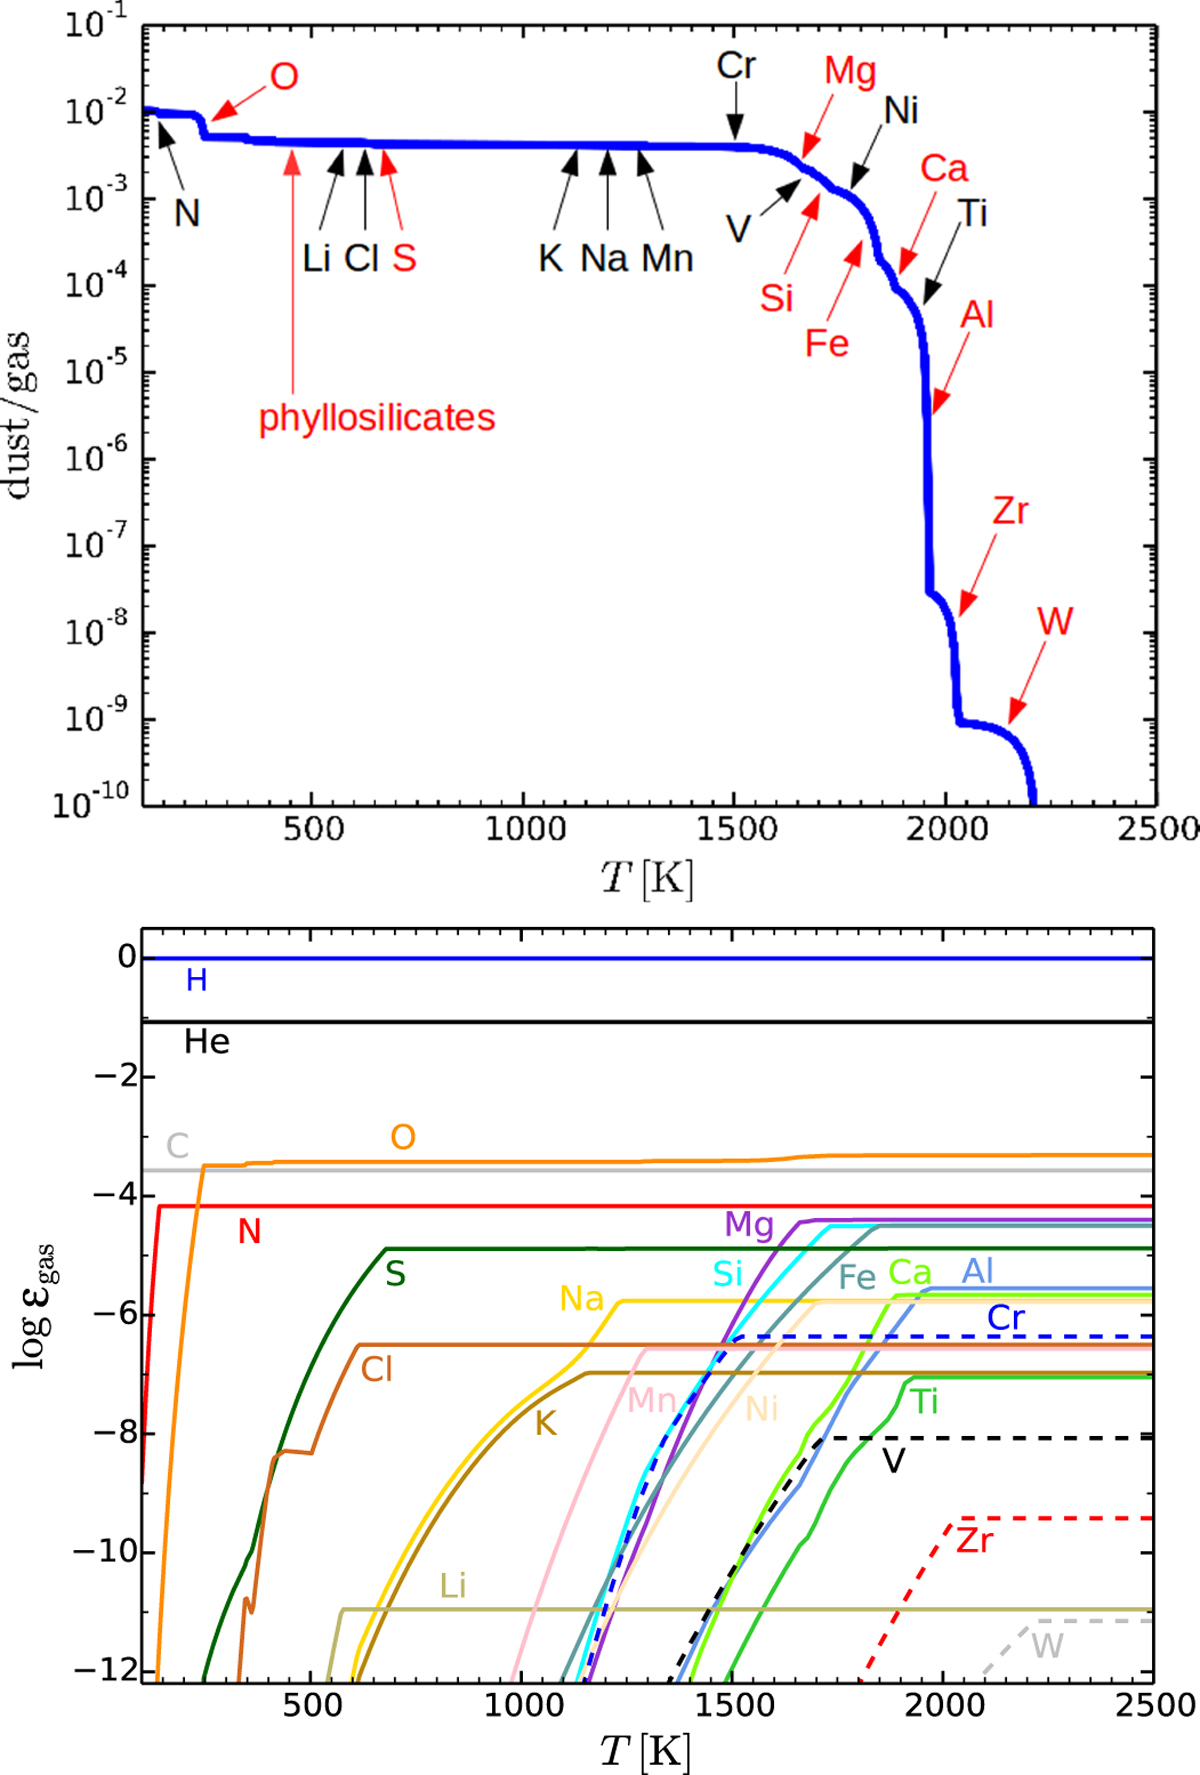
Upper part: dust to gas mass ratio in phase equilibrium as function of temperature at constant p = 1 bar for solar element abundances. The arrows indicate where the elements start forming condensed phases in significant amounts. The elements marked in red have a significant influence on the shape of the dust/gas(T)-curve. Lower part: remaining element abundances in the gas phase.
Current usage metrics show cumulative count of Article Views (full-text article views including HTML views, PDF and ePub downloads, according to the available data) and Abstracts Views on Vision4Press platform.
Data correspond to usage on the plateform after 2015. The current usage metrics is available 48-96 hours after online publication and is updated daily on week days.
Initial download of the metrics may take a while.