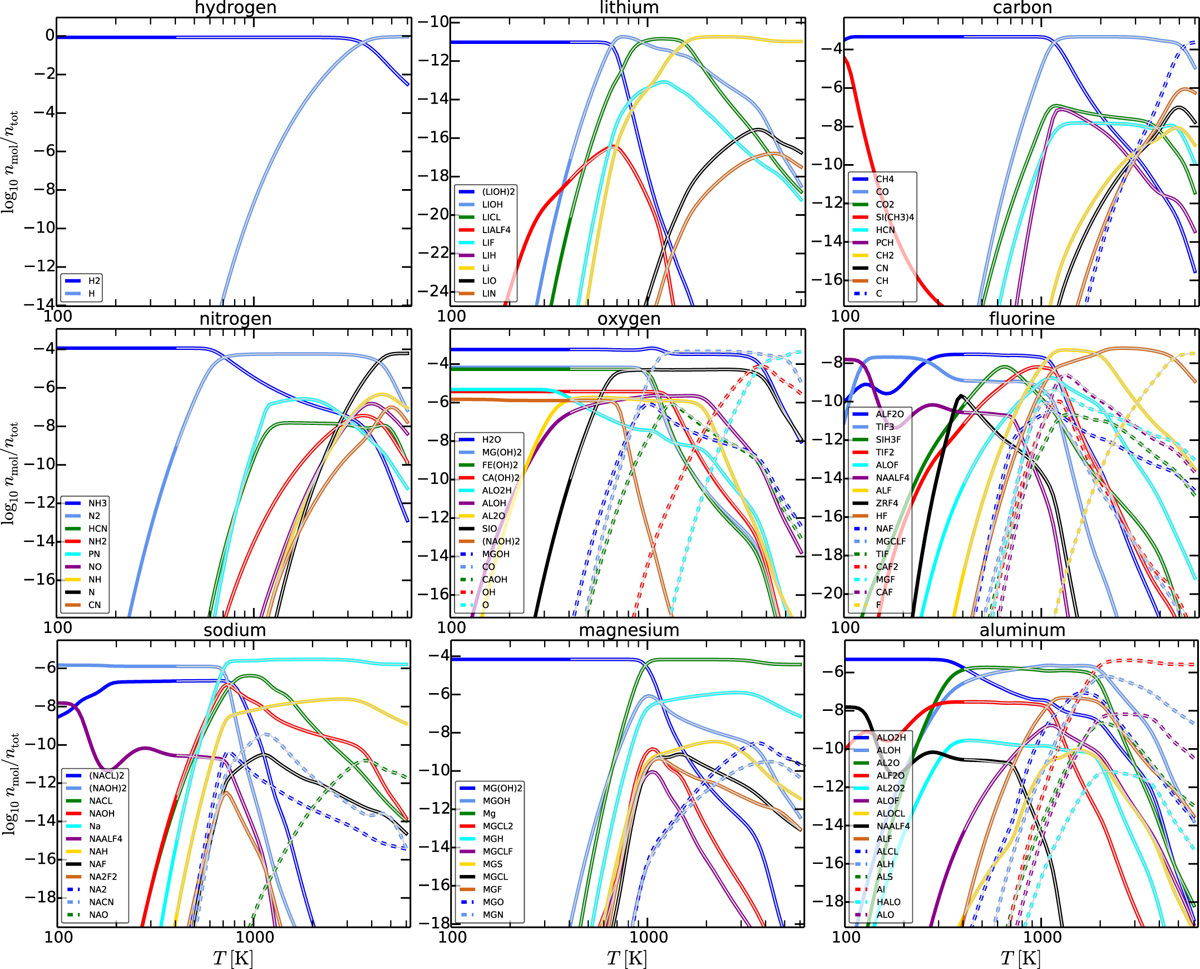
Fig. 3

Benchmark test against TEA (Blecic et al. 2016) at constant p = 1 bar and T = 100–6000 K, showing mixing ratios ni∕n. The coloured full and dashed curves are the GGCHEM results. The TEA results are overplotted with narrow grey lines. Only the most important molecules are shown, that is, those which reach a certain threshold concentration, depending on element. The TEA results stop at 400 K as TEA has difficulties converging at lower temperatures, even using 2000 iterations. The following molecules with notable concentrations are missing in TEA: SiH2, SiH3; CaH; TiS, TiH, TiN, TiC; CrH, CrS; MnH, MnS, MnCl, MnF, MnO; FeH; NiH, NiF, NiO, and the following molecules have been omitted by us in the TEA model to improve its convergence: Si(CH3)4, SiCH3 Cl3 and Ni(CO)4. Differences in the selection and availability of molecular species explain all visible deviations between GGCHEM and TEA.
Current usage metrics show cumulative count of Article Views (full-text article views including HTML views, PDF and ePub downloads, according to the available data) and Abstracts Views on Vision4Press platform.
Data correspond to usage on the plateform after 2015. The current usage metrics is available 48-96 hours after online publication and is updated daily on week days.
Initial download of the metrics may take a while.


