Fig. 11
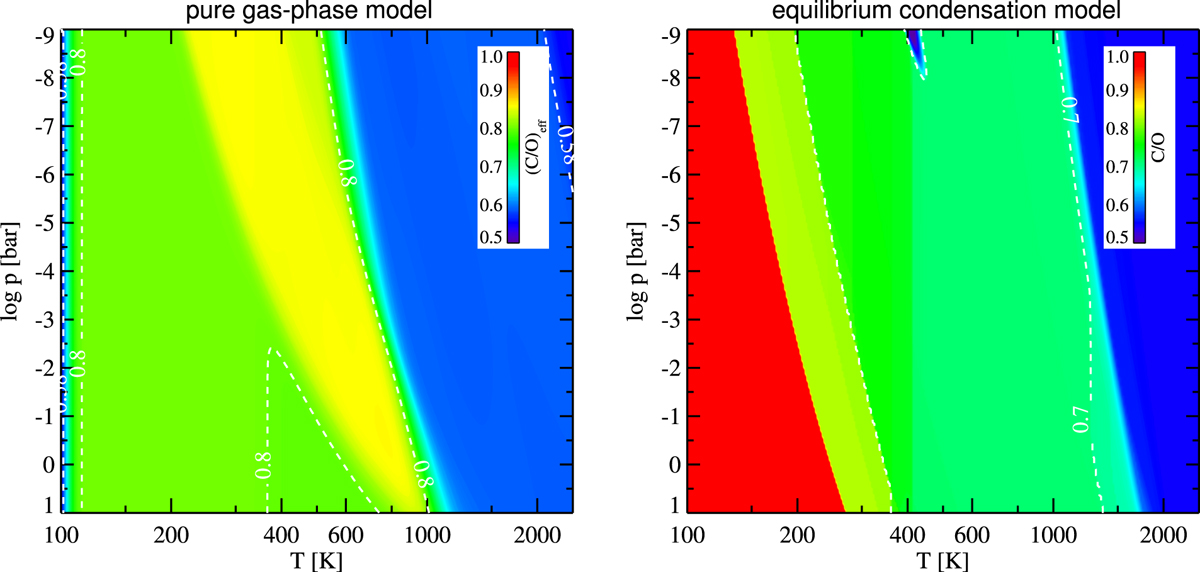
C/O ratio in the gas phase affected by the formation of metal oxide and hydroxide molecules (left) and condensation of silicates, phyllosilicates, and water ice (right). On the left side, we plot the “effective” C/O that is contained in the gas in form of molecules made of H–C–N–O only, but do not count metal oxide andhydroxide molecules. The contour lines shown are 0.58 (after SiO formation) and 0.8 (after Mg(OH)2 and Fe(OH)2 formation). On the right side, we plot the resulting gas phase abundances after the condensation of solids and liquids. The increase of C∕O > 0.7 is due to the consumption of oxygen by the major silicates like MgSiO3[s] and Mg2SiO4[s], and the further increase to >0.8 is due to phyllosilicates. The sharp increase at low temperatures (red area) is due to water condensation.
Current usage metrics show cumulative count of Article Views (full-text article views including HTML views, PDF and ePub downloads, according to the available data) and Abstracts Views on Vision4Press platform.
Data correspond to usage on the plateform after 2015. The current usage metrics is available 48-96 hours after online publication and is updated daily on week days.
Initial download of the metrics may take a while.