Free Access
Fig. A.3
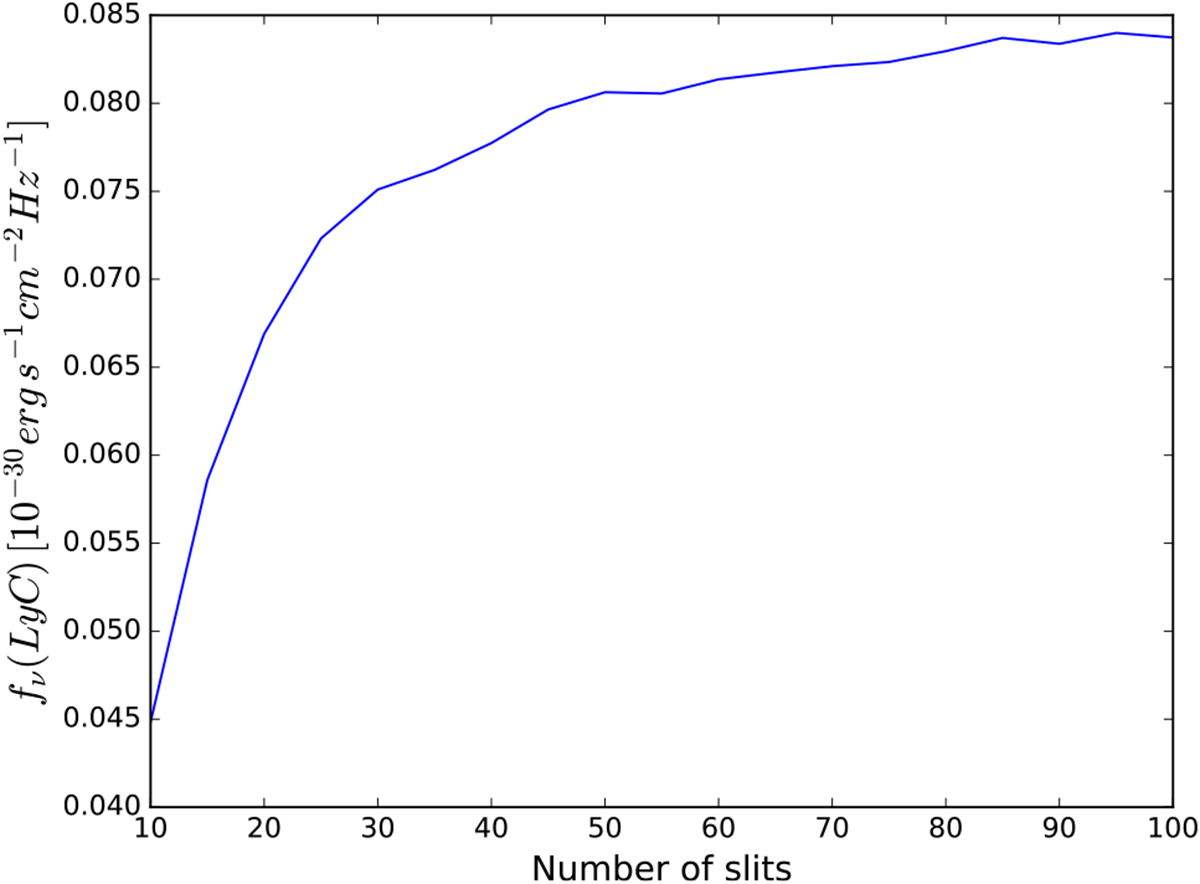
Simulated contamination flux as a function of the number of slits used in the simulations. The flux in the figure is the median value of the distribution and it is expressed in units of 10−30 erg s−1cm−2 Hz−1.
Current usage metrics show cumulative count of Article Views (full-text article views including HTML views, PDF and ePub downloads, according to the available data) and Abstracts Views on Vision4Press platform.
Data correspond to usage on the plateform after 2015. The current usage metrics is available 48-96 hours after online publication and is updated daily on week days.
Initial download of the metrics may take a while.