Fig. 6
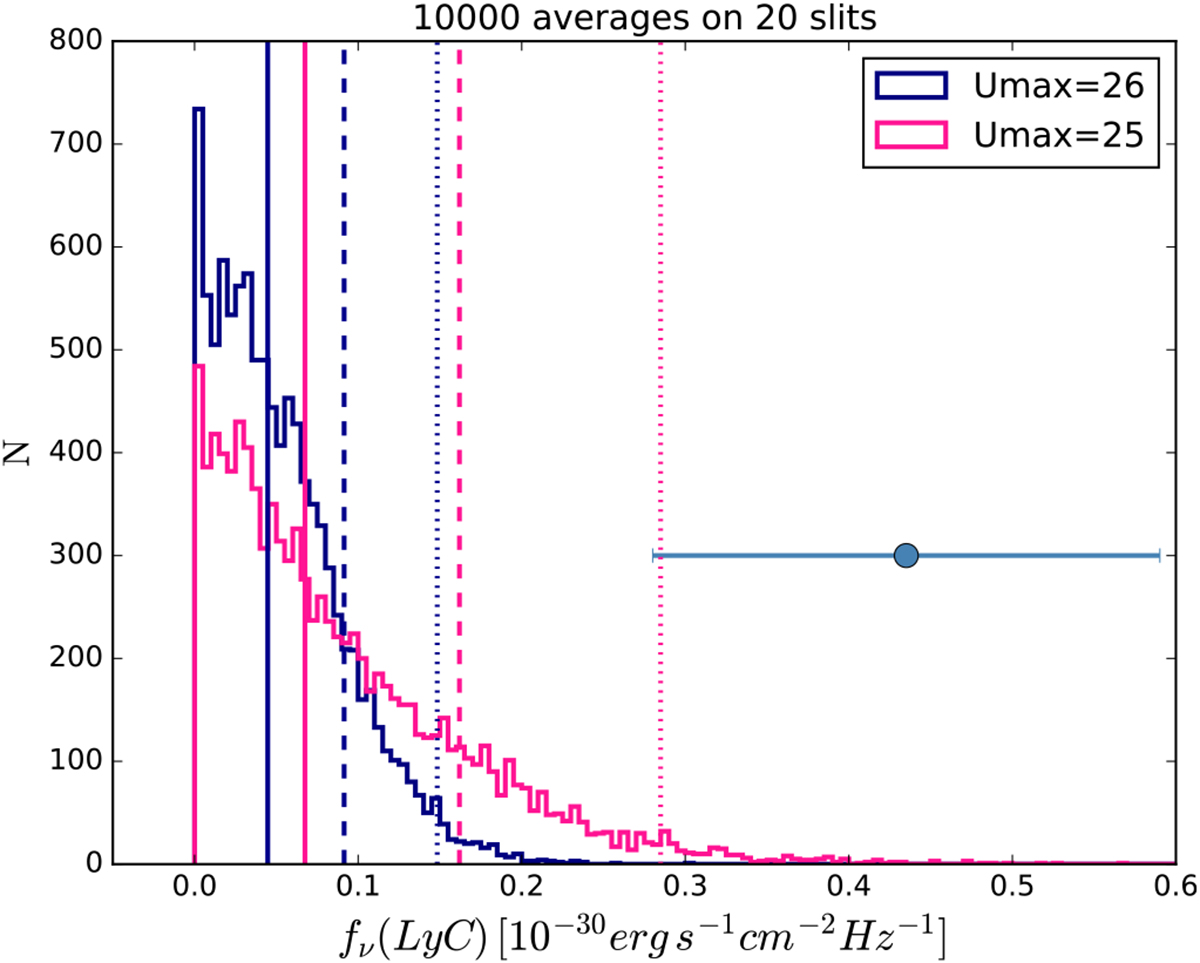
Distribution of the simulated observed-frame ![]() coming from foreground sources for the sub-sample with Lyαext ≤ 5.7 kpc imposing Umax = 25 (magenta histogram) and Umax = 26 (blue histogram). The continuum vertical lines are the median of the distributions and the dashed and dotted lines are the 1σ and 2σ confidence intervals, respectively. The symbol in the figure is the average observed-frame
coming from foreground sources for the sub-sample with Lyαext ≤ 5.7 kpc imposing Umax = 25 (magenta histogram) and Umax = 26 (blue histogram). The continuum vertical lines are the median of the distributions and the dashed and dotted lines are the 1σ and 2σ confidence intervals, respectively. The symbol in the figure is the average observed-frame ![]() obtained forthe sub-sample.
obtained forthe sub-sample.
Current usage metrics show cumulative count of Article Views (full-text article views including HTML views, PDF and ePub downloads, according to the available data) and Abstracts Views on Vision4Press platform.
Data correspond to usage on the plateform after 2015. The current usage metrics is available 48-96 hours after online publication and is updated daily on week days.
Initial download of the metrics may take a while.