Fig. 4
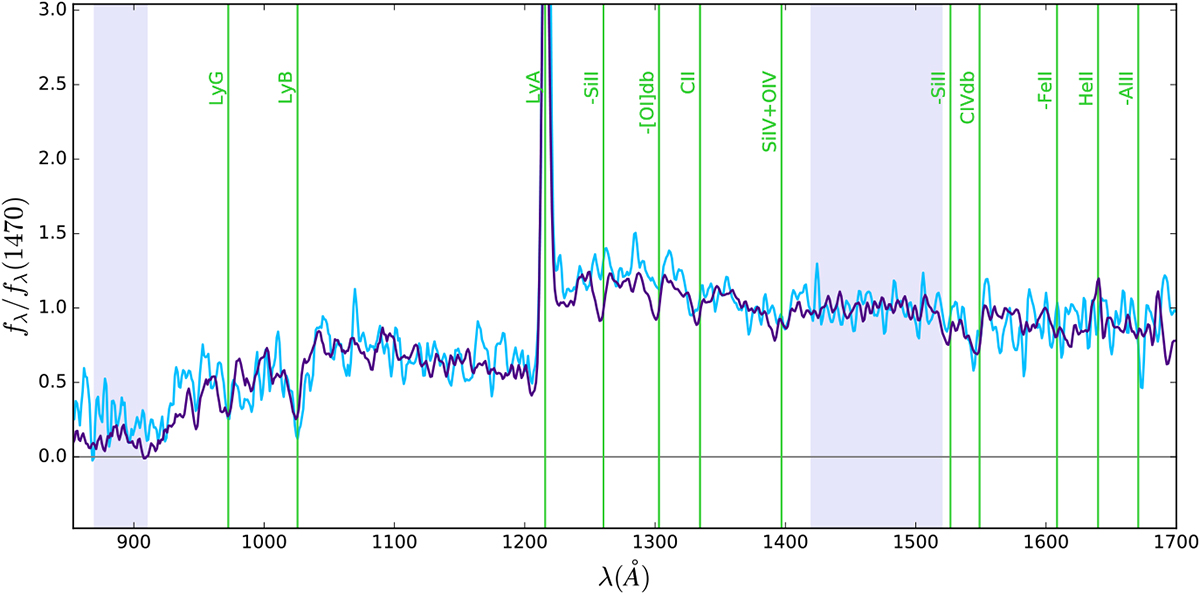
Comparison of the spectral stacks of the sub-samples with Lyαext ≤ 5.7 kpc (cyan line) and with Lyαext > 5.7 kpc (purple line). The vertical lavender bands indicate the LyC range (870−910 Å) and the UV range (1420−1520 Å) where we have normalized each spectrum. The signal in the LyC range in the stack of the sub-sample with Ly αext≤ 5.7 kpc is about 2.5 times higher than that of the sub-sample with Lyαext > 5.7 kpc. The spectra in the figure have been smoothed by three times the step of the stacked spectrum, which is 1.06 Å for the stack of the sub-sample with Lyαext ≤ 5.7 kpc and 1.12 Å for the sub-sample with Lyαext > 5.7 kpc, to emphasize the difference in the LyC region between the two sub-samples.
Current usage metrics show cumulative count of Article Views (full-text article views including HTML views, PDF and ePub downloads, according to the available data) and Abstracts Views on Vision4Press platform.
Data correspond to usage on the plateform after 2015. The current usage metrics is available 48-96 hours after online publication and is updated daily on week days.
Initial download of the metrics may take a while.