Fig. 7
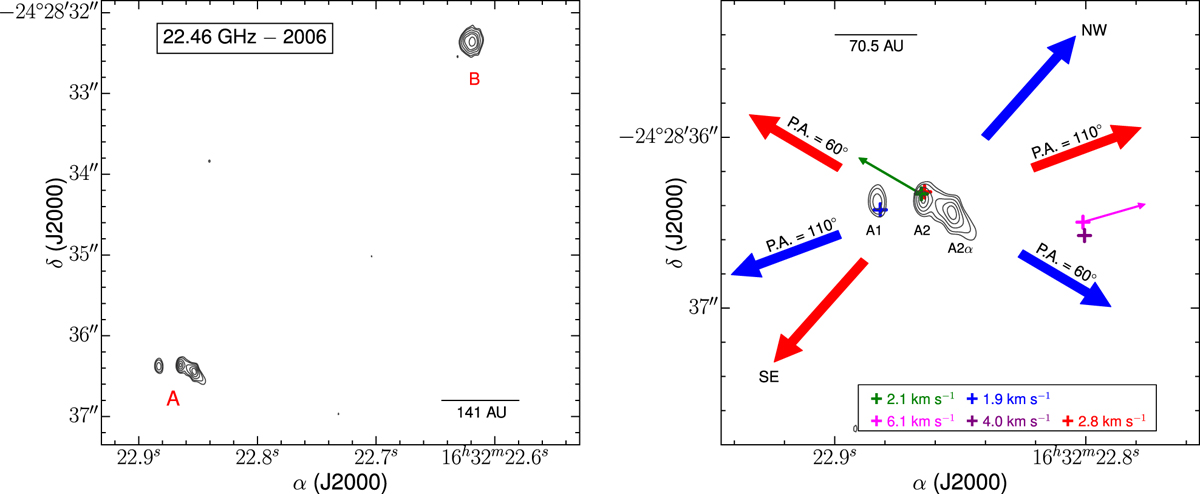
Stellar system I16293. Left: continuum map at 22 GHz taken with the VLA on 2006 February 10. The noise level of this image is 47 μJy beam−1, and the contour levels are −4, 4, 6, 10, 15, 20, and 30 times this value. Right: zoom-in on source A. Shown are the sources composing this system: A1, A2, and the ejecta A2α. Also shown are the directions of the three outflows (blue and red arrows). The colored crosses represent the positions of the maser spots detected at different velocities (see Table 2). The magenta cross indicates the position of the masers at 6.1 km s−1 and the magenta arrow arising from it shows the mean proper motion direction, while the green arrow indicates the proper motion direction of the maser spot at 2.1 km s−1 identified on epochs I and J. The blue cross indicates the position of the maser emission detected in epoch R at 1.9 km s−1, very close to source A1, and the red cross marks the position of the maser spot at 2.8 km s−1 close to source A2 and detected in epoch F. The position of the maser spot detected in epoch R at 4.0 km s−1 is shown with a purple cross. The arrow lengths do not represent velocity magnitudes, but only the direction of the outflows and the proper motions of the masers. Also included is a reference of the physical scale on both images.
Current usage metrics show cumulative count of Article Views (full-text article views including HTML views, PDF and ePub downloads, according to the available data) and Abstracts Views on Vision4Press platform.
Data correspond to usage on the plateform after 2015. The current usage metrics is available 48-96 hours after online publication and is updated daily on week days.
Initial download of the metrics may take a while.