Fig. 4
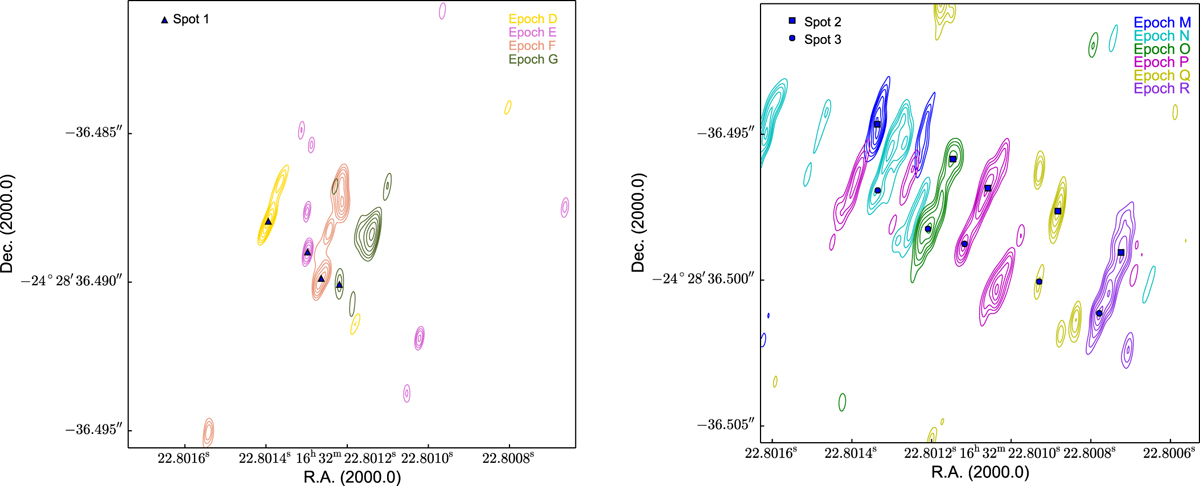
Superposition of the detected spots. For clarity and to guide the eye, left panel: spots detected in the first four epochs (epoch D–G; see Table 1). Right panel: spots detected from epochs M to R. The contour levels are 0.3, 0.4, 0.5, 0.65, 0.80, and 0.95 times the peak flux of each image. Triangles indicate the emission peaks of spot 1; squares and circles correspond to spot 2 and 3, respectively.
Current usage metrics show cumulative count of Article Views (full-text article views including HTML views, PDF and ePub downloads, according to the available data) and Abstracts Views on Vision4Press platform.
Data correspond to usage on the plateform after 2015. The current usage metrics is available 48-96 hours after online publication and is updated daily on week days.
Initial download of the metrics may take a while.