Fig. 9
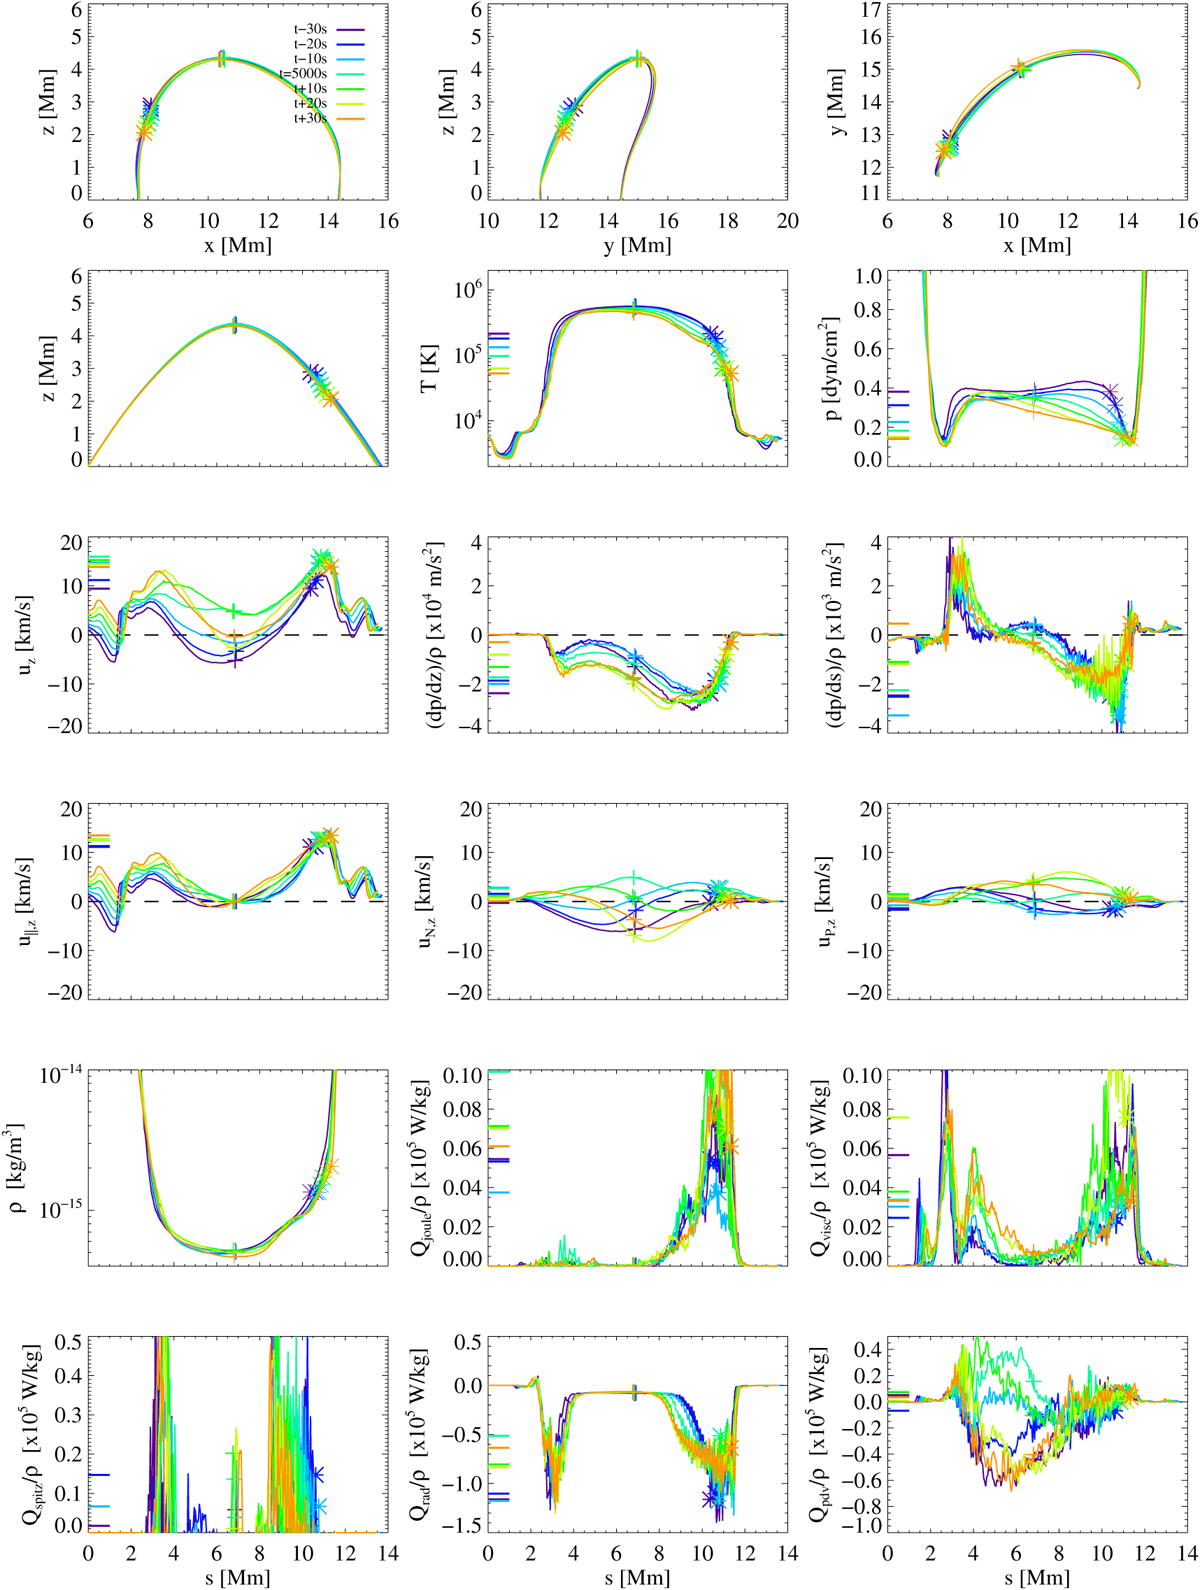
Evolution of field line parameters extracted for a low-lying field line including a downward moving transition region cork. Top row: projections of the field line on the xz-, yz-, and xy-planes. The field line parameters are shown as a function of the coordinate s along the field line, where s = 0 Mm corresponds to the position of the right footpoint of the loop in the panels of the top row. The evolution of the field line parameters is shown for t = 5000 ± 30 s, and the field line evolves from dark blue colors to red colors. The cork positions are indicated by asterisks and the loop apices by crosses.
Current usage metrics show cumulative count of Article Views (full-text article views including HTML views, PDF and ePub downloads, according to the available data) and Abstracts Views on Vision4Press platform.
Data correspond to usage on the plateform after 2015. The current usage metrics is available 48-96 hours after online publication and is updated daily on week days.
Initial download of the metrics may take a while.