Fig. 8
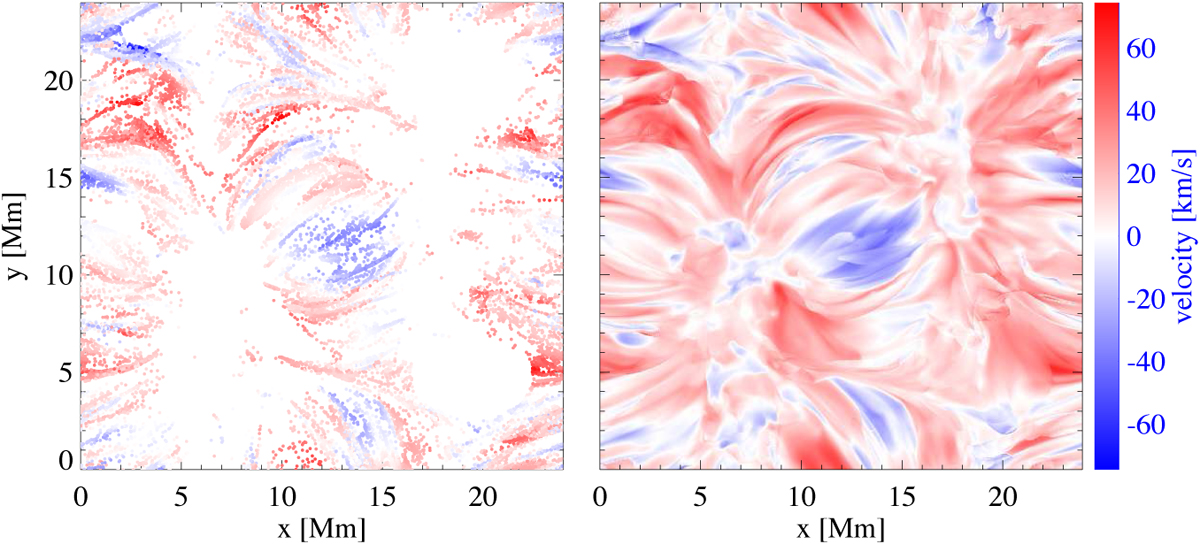
Left: xy-positions of corks with logT = [4.99, 5.01] at t = 5000 s, color-coded with vertical cork velocity. Red indicates downflows; blue shows upflows. Right: C iv (1548 Å) Doppler shift map for t = 5000 s. Blue indicates blueshifts (upflows), red shows redshifts (downflows). The color bar on the right shows the velocity scales; the same range has been chosen for both panels.
Current usage metrics show cumulative count of Article Views (full-text article views including HTML views, PDF and ePub downloads, according to the available data) and Abstracts Views on Vision4Press platform.
Data correspond to usage on the plateform after 2015. The current usage metrics is available 48-96 hours after online publication and is updated daily on week days.
Initial download of the metrics may take a while.