Fig. 6
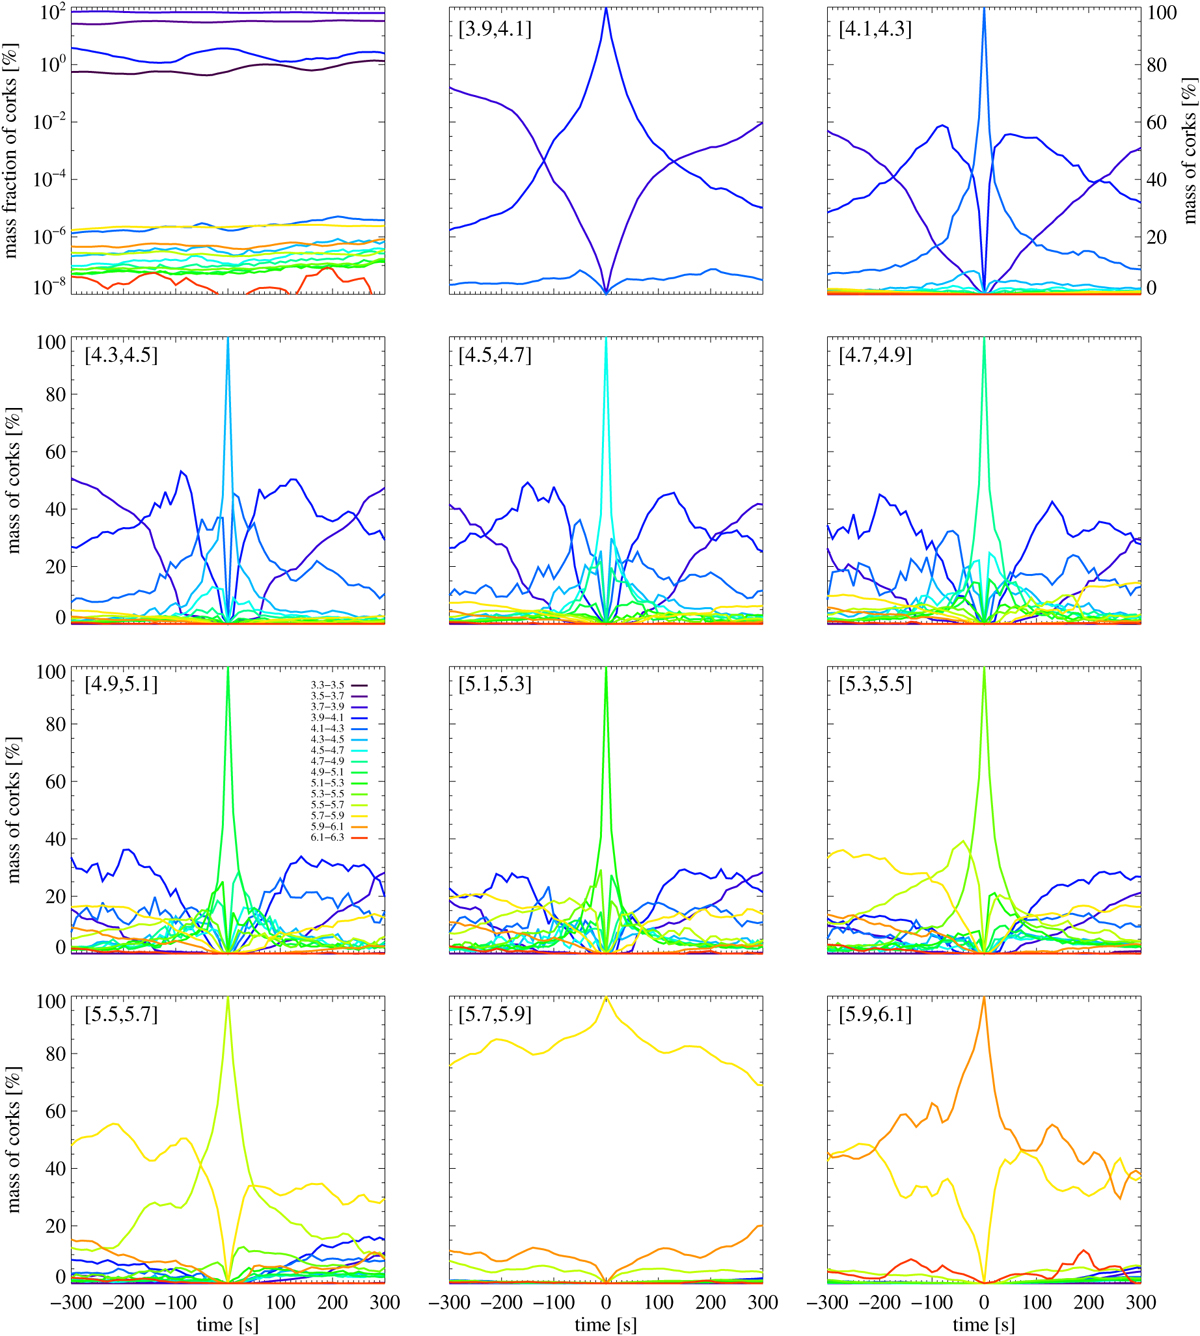
Upper left panel: temporal evolution of cork masses in a given temperature bin for a 10-min timespan around t = 5000 s. Only atmospheric corks are considered. The temperature bins are divided into temperature intervals of log T = 0.2 dex, and each bin is represented by a different color (see legend in panel labeled [4.9, 5.1]). The fraction with respect to the total mass of all atmospheric corks is shown (see Sect. 4.3). Rows 1 (middle and right panel)–4: temporal evolution (t ± 300 s) of the mass of corks within a given temperature bin. Only corks that contribute to the selected bin are considered, and all panels are normalized to 100. The same legend applies for all panels.
Current usage metrics show cumulative count of Article Views (full-text article views including HTML views, PDF and ePub downloads, according to the available data) and Abstracts Views on Vision4Press platform.
Data correspond to usage on the plateform after 2015. The current usage metrics is available 48-96 hours after online publication and is updated daily on week days.
Initial download of the metrics may take a while.