Fig. 4
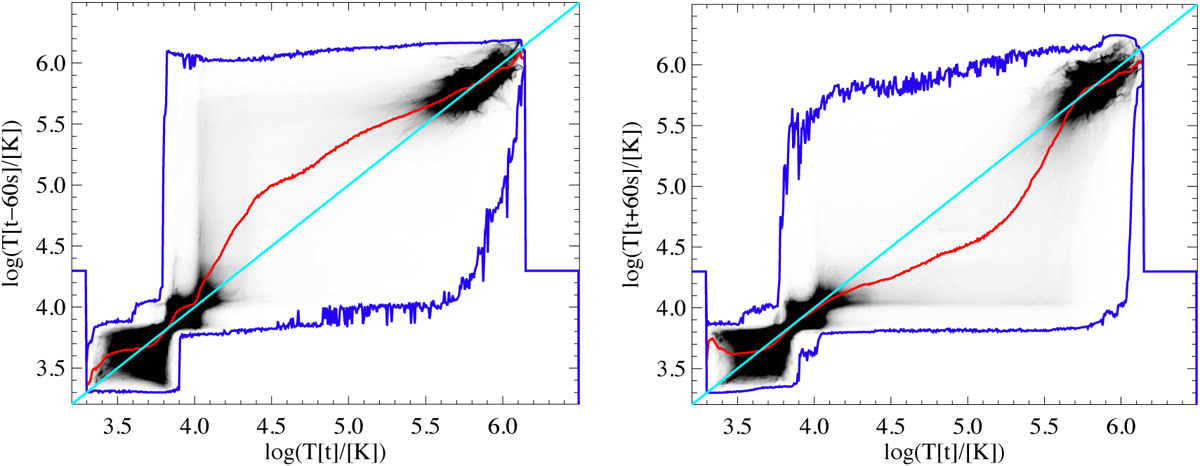
Probability density functions (PDFs) of cork temperature. The PDFs are shown with respect to t = 5000 s for t = 4940 s (left panel) and t = 5060 s (right panel; see Sect. 4.2). The distribution of corks at t = 5000 s is shown by a turquoise line in each panel. The average cork temperature at each timestep is indicated by the red line. The blue lines show the minimum and maximum temperature of all corks for the respective height.
Current usage metrics show cumulative count of Article Views (full-text article views including HTML views, PDF and ePub downloads, according to the available data) and Abstracts Views on Vision4Press platform.
Data correspond to usage on the plateform after 2015. The current usage metrics is available 48-96 hours after online publication and is updated daily on week days.
Initial download of the metrics may take a while.