Fig. 3
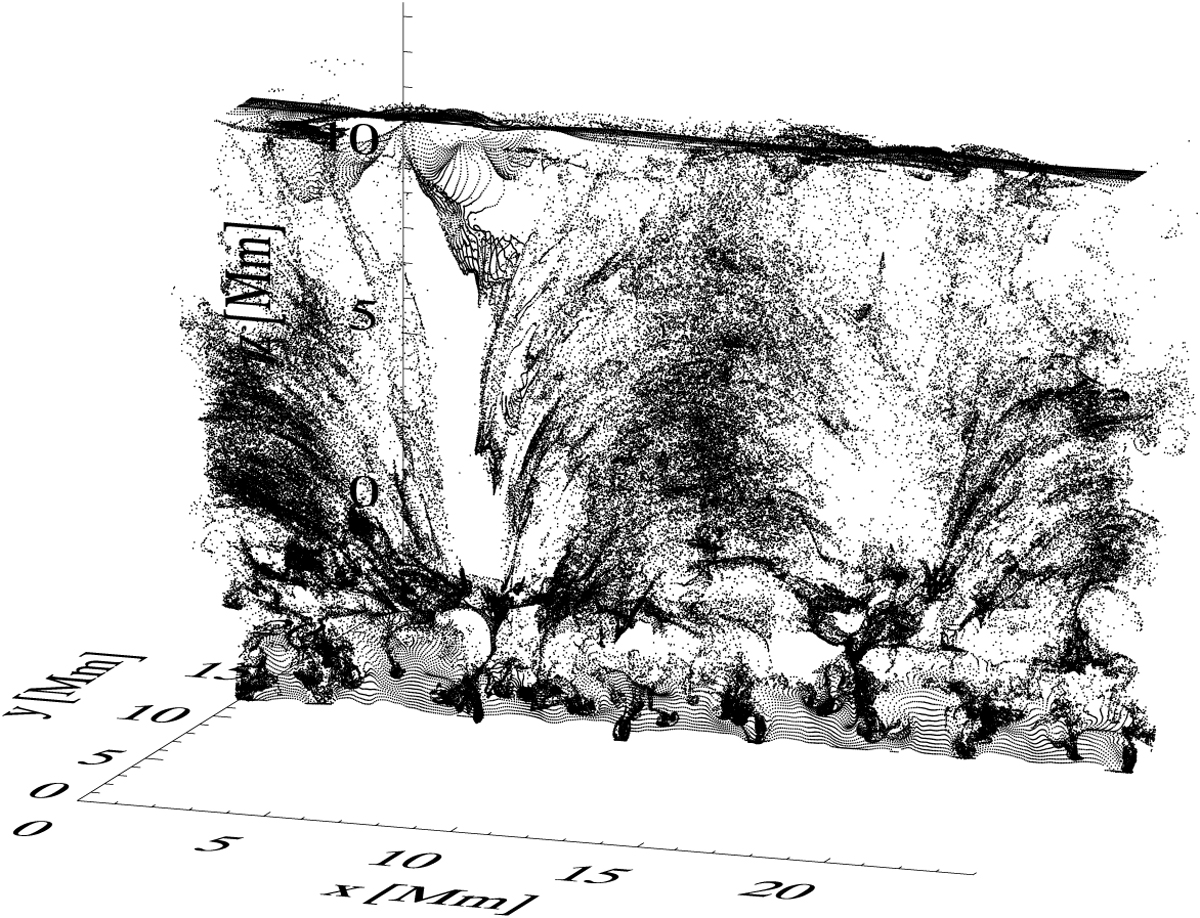
Spatial distribution of corks, which have initially been placed in the y = 12 Mm plane of the simulation box, 15 min into the simulation. Every single dot indicates the position of one cork. Dark regions indicate regions, where the cork density is high; white regions represent voids of corks, i.e., regions where no corks are present. As time evolves, the corks start moving in both horizontal and vertical direction, thus slowly moving out of the y = 12 Mm plane (see Sect. 4.1). A movie showing the evolution over 25 min is available online.
Current usage metrics show cumulative count of Article Views (full-text article views including HTML views, PDF and ePub downloads, according to the available data) and Abstracts Views on Vision4Press platform.
Data correspond to usage on the plateform after 2015. The current usage metrics is available 48-96 hours after online publication and is updated daily on week days.
Initial download of the metrics may take a while.