Fig. 2
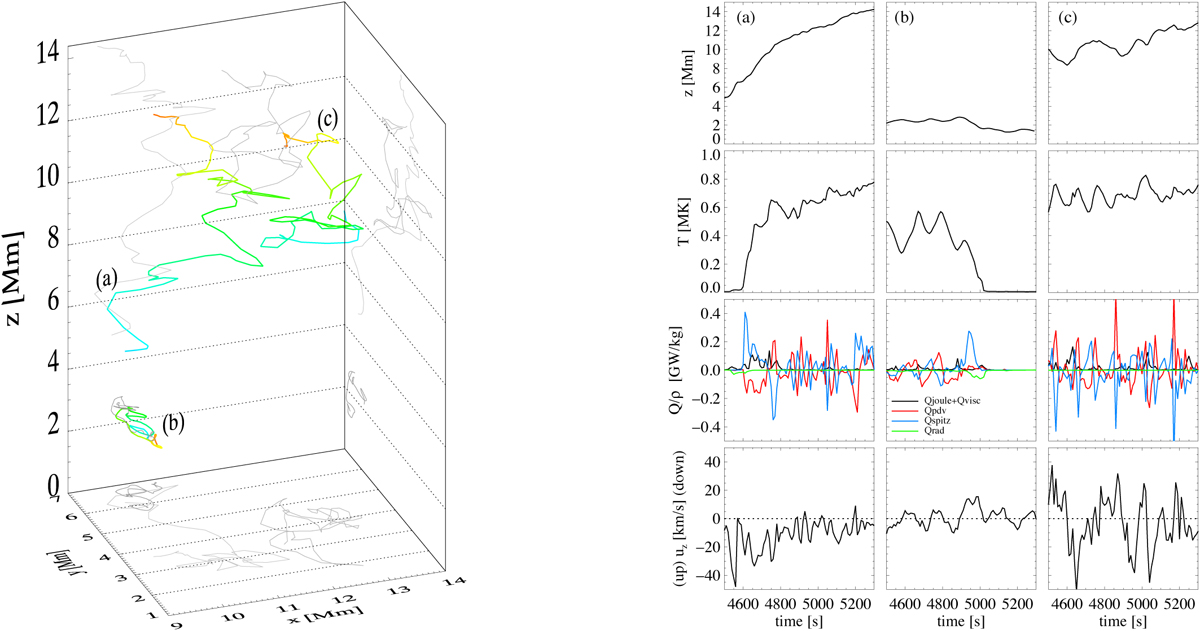
Left panel: cork trajectories of three representative examples described in Sect. 4.1. The temporal evolution for 800 s is shown. As time evolves, the colors change from blue to red. The respective projections in the xy-, xz- and yz-plane are indicated in different shades of gray for the different corks, which have been labeled (a), (b), and (c). Right panel: shown from top to bottom for the three examples on the left are the temporal evolution of cork height, cork temperature, vertical velocity, and heating and cooling terms per particle, i.e., the sum of Joule heating and viscous heating (black), adiabatic compression/expansion (red), Spitzer heat conduction (blue) and radiative losses (green). In the velocity panel, negative velocities are pointing upward, positive velocities are pointing downward. The first column shows the evolution of cork (a), which is heated from chromospheric to upper transition region temperatures starting at ~ t = 4600 s; the second column shows the evolution of cork (b), which quickly cools from transition region to chromospheric temperatures at ~t = 4900 s; and the third column shows the evolution of cork (c), which remains in the upper transition region throughout the entire simulation.
Current usage metrics show cumulative count of Article Views (full-text article views including HTML views, PDF and ePub downloads, according to the available data) and Abstracts Views on Vision4Press platform.
Data correspond to usage on the plateform after 2015. The current usage metrics is available 48-96 hours after online publication and is updated daily on week days.
Initial download of the metrics may take a while.