Fig. 1
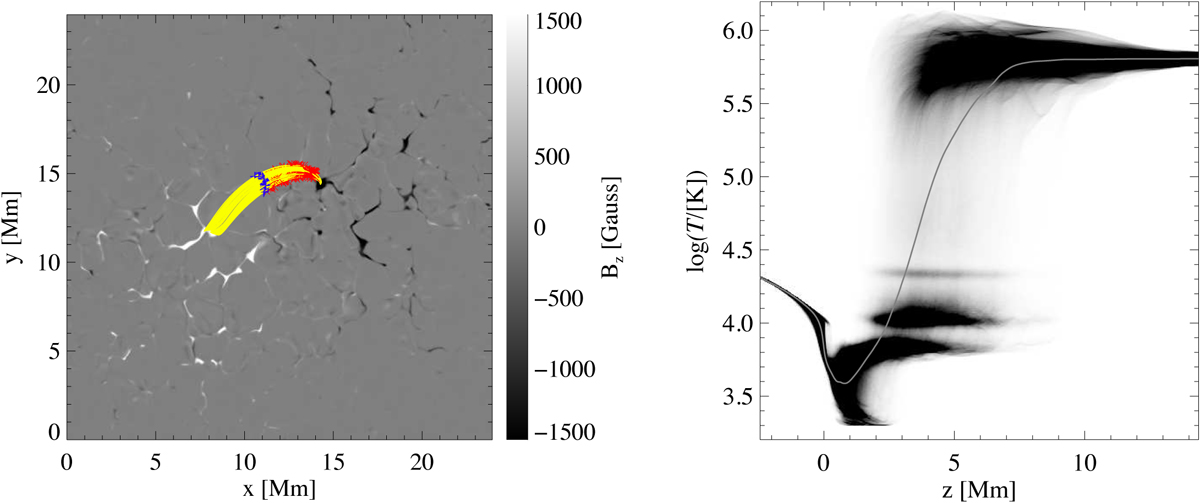
Left panel: vertical magnetic field strength at height z = 0 Mm for timestep t = 5000 s. The color bar range is [–1.5 kG, +1.5 kG]. A set of magnetic field lines connecting the main magnetic polarities is overplotted in yellow in the left panel. Field line apices and cork positions of corks with T = 105 K are indicated by blue and red crosses. These field lines are further discussed in Sect. 4.4. Right panel: temperature distribution of the simulation grid points as a function of height for timestep t = 5000 s of the simulation. The average temperature at a given height is indicated by the gray line.
Current usage metrics show cumulative count of Article Views (full-text article views including HTML views, PDF and ePub downloads, according to the available data) and Abstracts Views on Vision4Press platform.
Data correspond to usage on the plateform after 2015. The current usage metrics is available 48-96 hours after online publication and is updated daily on week days.
Initial download of the metrics may take a while.