Fig. 9
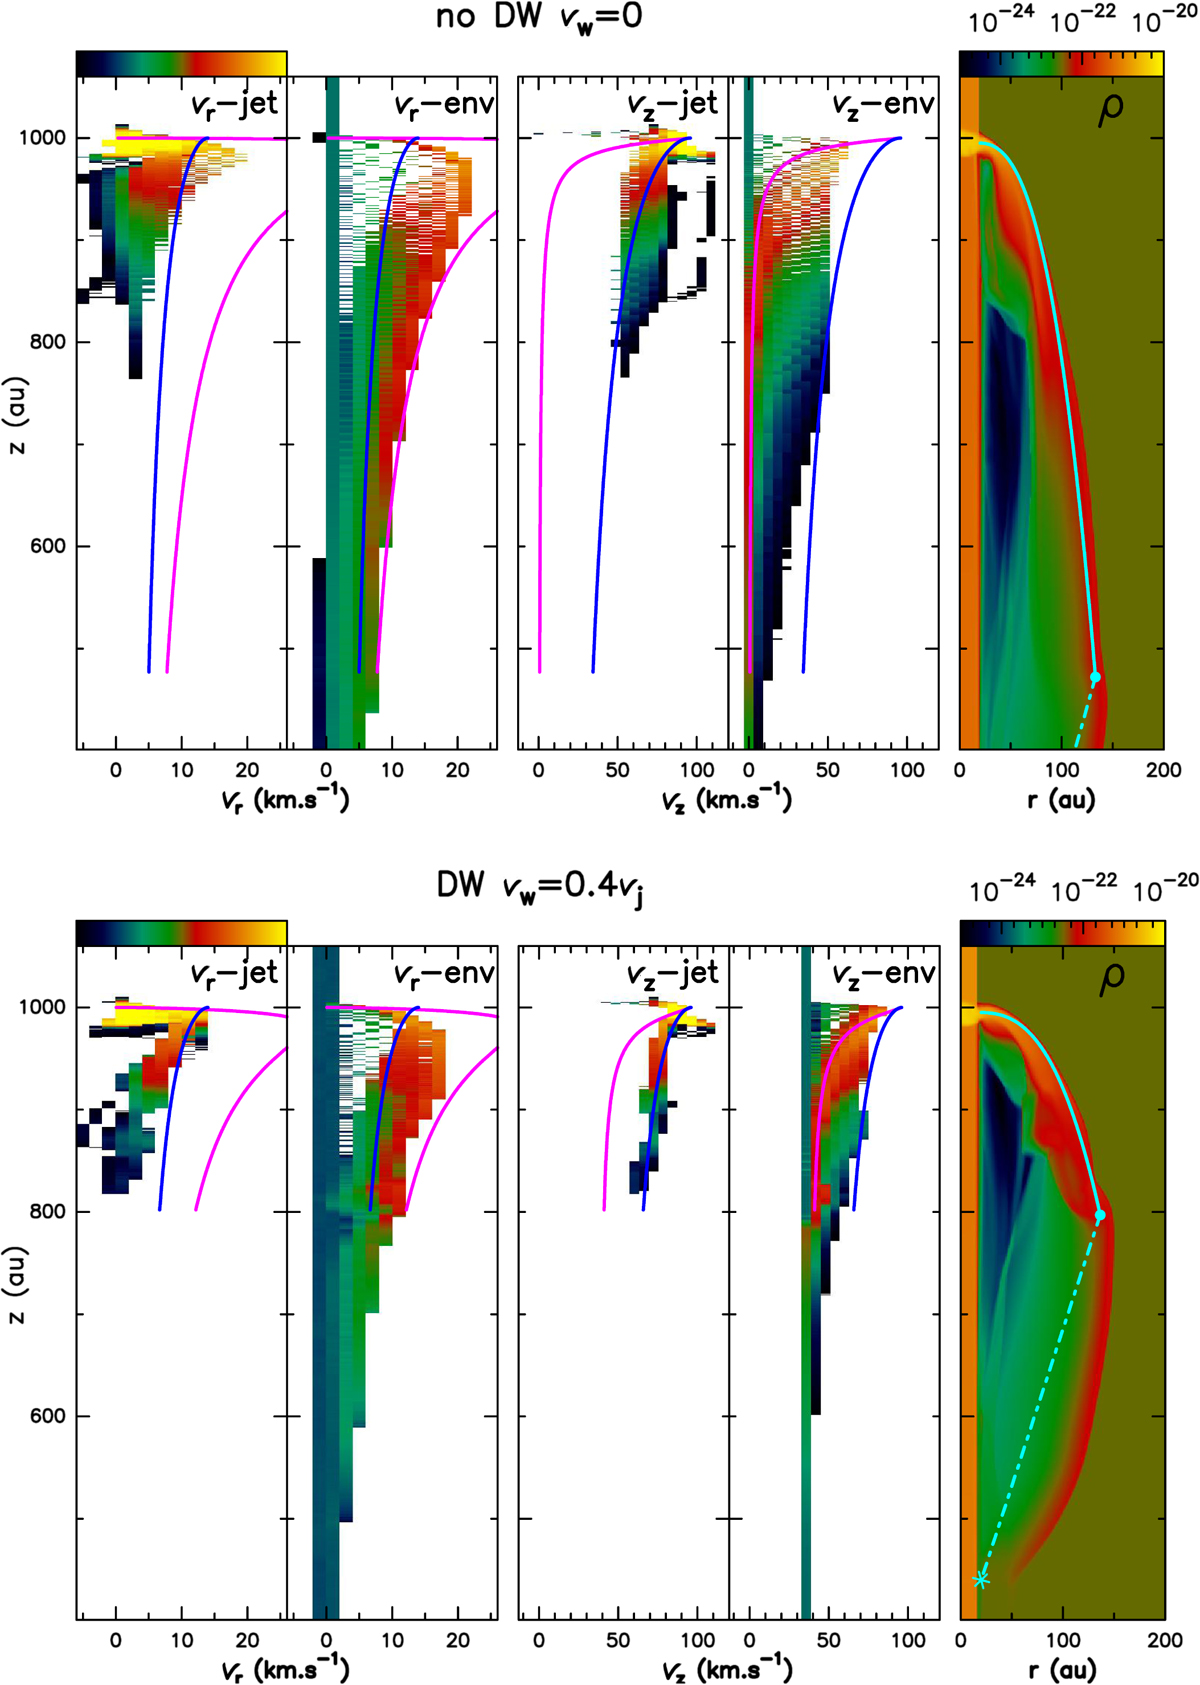
Longitudinal position-velocity (PV) diagrams for the no DW simulation (top) and the DW simulation (bottom). From left to right: vr for the jet material only, vr for the surrounding material only, vz for the jet material only, vz for the surrounding material only, and density stratification. The ordinate of all frames is position along the outflow axis (in au). The color scale in the PVs is scaled by volume × cube of pressure so as to be maximum (in red and yellow shades) for shocked material in the shell, while the color scale for density is in g cm−3. Blue curves are predicted velocities in the full mixing hypothesis (Eqs. (16) and (17)), while magenta curves are the predicted immediate-post shock velocities (Eqs. (18) and (19)).
Current usage metrics show cumulative count of Article Views (full-text article views including HTML views, PDF and ePub downloads, according to the available data) and Abstracts Views on Vision4Press platform.
Data correspond to usage on the plateform after 2015. The current usage metrics is available 48-96 hours after online publication and is updated daily on week days.
Initial download of the metrics may take a while.