Fig. 8
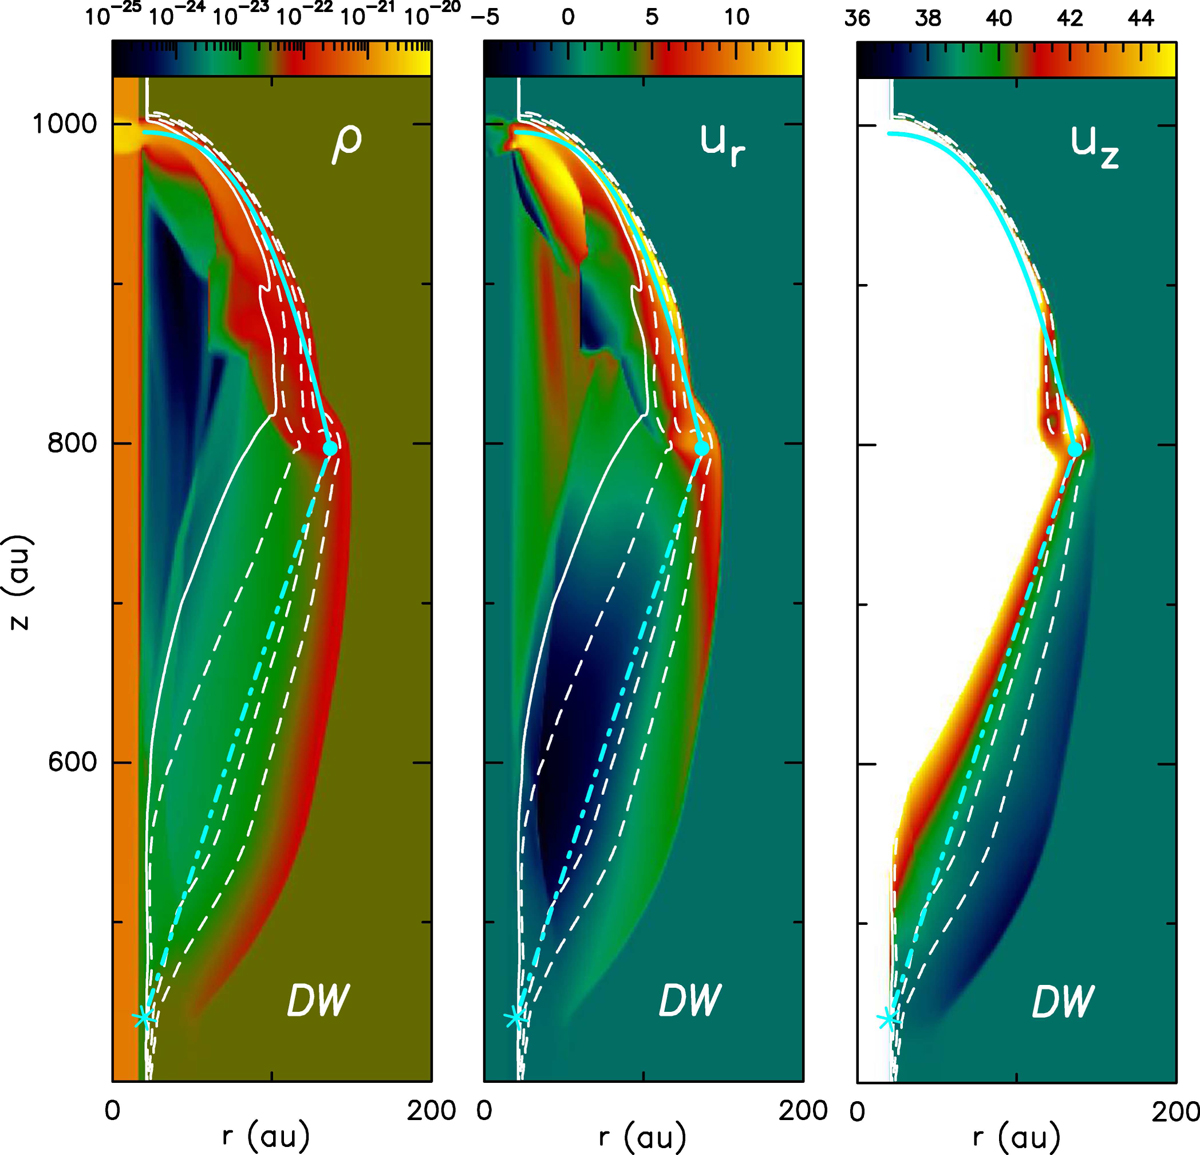
Zoom of the leading IWS of the simulation with a surrounding disk wind at time t = 48 yr. Left: density stratification (with the logarithmic color scale given by the top bar in g cm−3), center: radial velocity (with the linear scale of top bar in km s͔–1) and right: axial velocity structure (with the linear scale of the top bar in km s−1). The white contours show the surfaces of 50 % (solid line), 10 %, 0.1 % and 0.001 % (outer contour) jet material mixing fractions. The cyan asterisk is the predicted vertex of the cavity, the cyan dash-dotted line in the predicted boundary of the cavity, and the cyan curve is the fitted shape of the bow shock.
Current usage metrics show cumulative count of Article Views (full-text article views including HTML views, PDF and ePub downloads, according to the available data) and Abstracts Views on Vision4Press platform.
Data correspond to usage on the plateform after 2015. The current usage metrics is available 48-96 hours after online publication and is updated daily on week days.
Initial download of the metrics may take a while.