Fig. 7
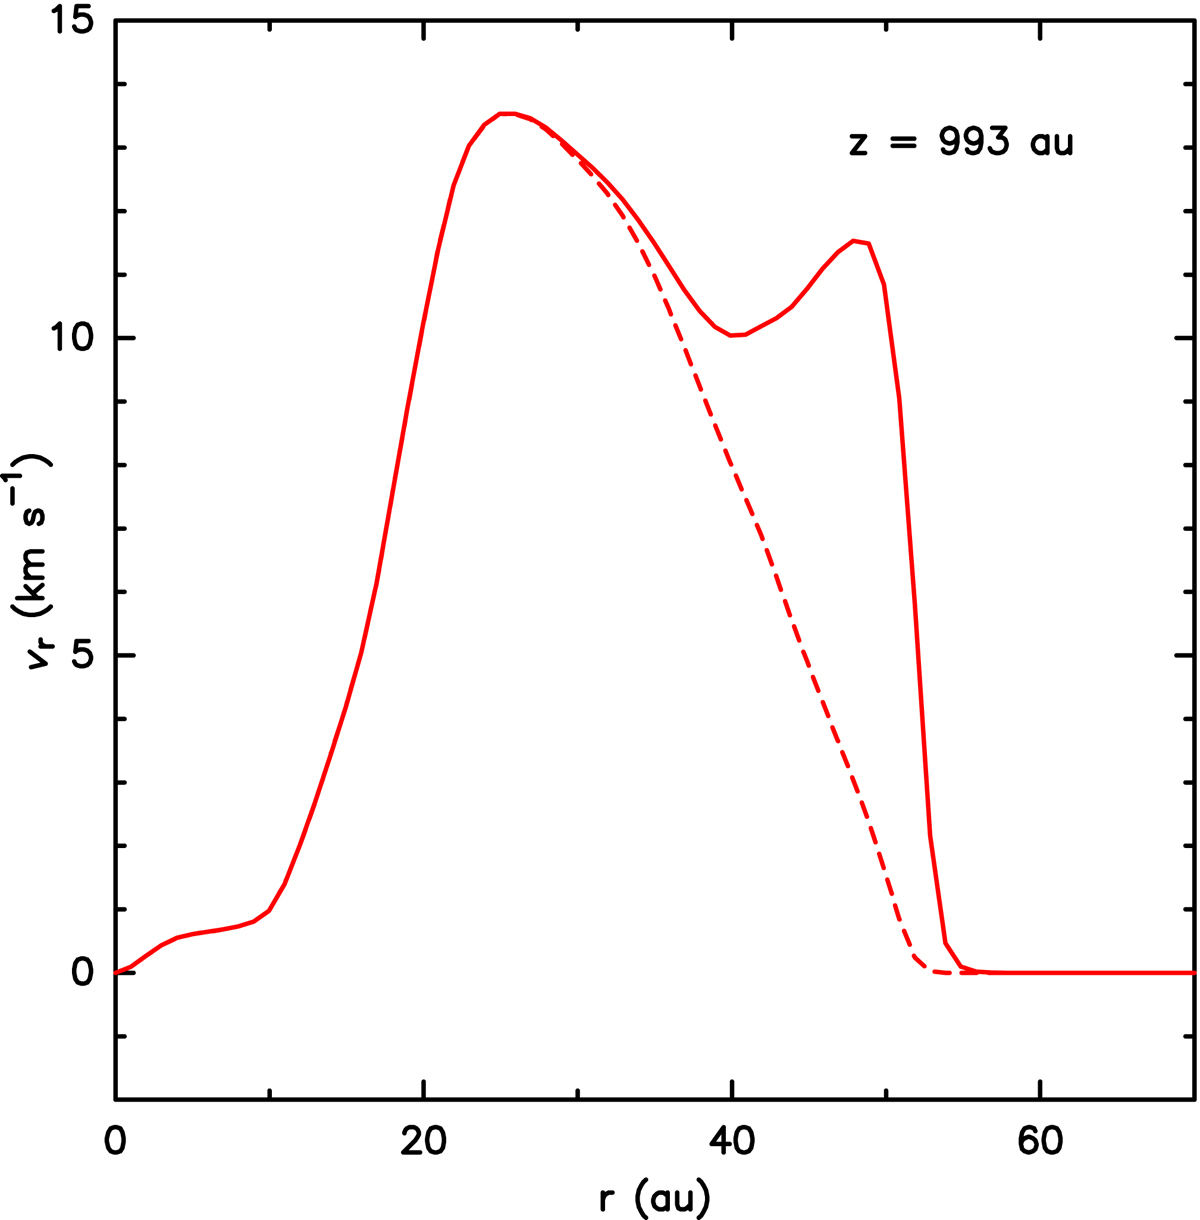
Transverse cut across the flow at the IWS location (z = 993 au) in the no-DW time-frame shown in Fig. 6. This cut shows the radial velocity as a function of distance from the jet axis in solid line. We also plot the radial velocity weighted by the abundance of the jet tracer with a dashed line. The radial velocity first grows outwards, reaches a maximum velocity of ≈ 14 km s−1 at a radius of ∼ 25 au (somewhat larger than the 20 au initial jet radius), and then remains with values > 10 km s−1 until it drops sharply to 0 at r ∼ 50 au. The velocity maximum at r ∼ 25 au corresponds to the shock against the jet material. The second maximum at r ∼ 50 au is the shock that propagates in the disk-wind and the zero radial velocity material at larger radii is the undisturbed disk wind.
Current usage metrics show cumulative count of Article Views (full-text article views including HTML views, PDF and ePub downloads, according to the available data) and Abstracts Views on Vision4Press platform.
Data correspond to usage on the plateform after 2015. The current usage metrics is available 48-96 hours after online publication and is updated daily on week days.
Initial download of the metrics may take a while.