Fig. 6
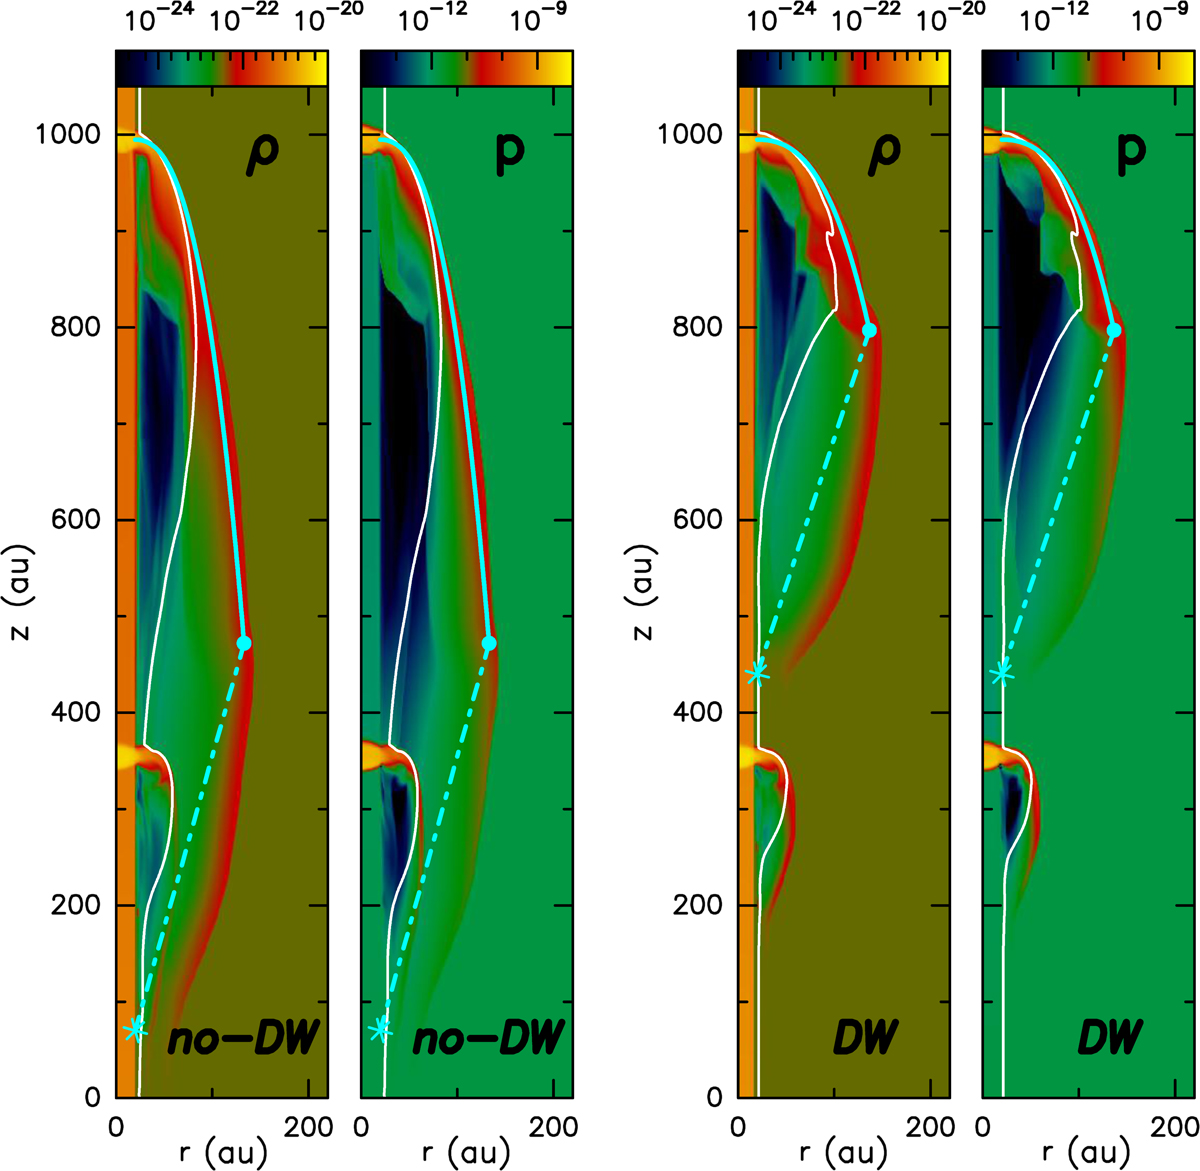
Maps of density and pressure for the reference no-DW simulation with vw = 0 (left) and the DW simulation with vw = 0.4vj(right) at a time t = 48 yr. Color scales on top are in g cm−3 for density and in dyn cm−2 for pressure. White contours show the locus of 50% mixing ratio between jet and disk-wind/ambient material. The cyan curve shows a fit (to the numerical results) by the analytic shell shape in Eq. (11), with L0 = 65 au (left) and 108 au (right). The cyan dot indicates the maximum radius of the shell, the cyan asterix indicates the predicted vertex of the empty conical cavity left behind the shell, and the cyan dash-dotted line is the analytical predicted boundary between the emptied cavity and the region refilled from below by fresh disk wind (see Fig. 2 and Eq. (15)).
Current usage metrics show cumulative count of Article Views (full-text article views including HTML views, PDF and ePub downloads, according to the available data) and Abstracts Views on Vision4Press platform.
Data correspond to usage on the plateform after 2015. The current usage metrics is available 48-96 hours after online publication and is updated daily on week days.
Initial download of the metrics may take a while.