Fig. 4
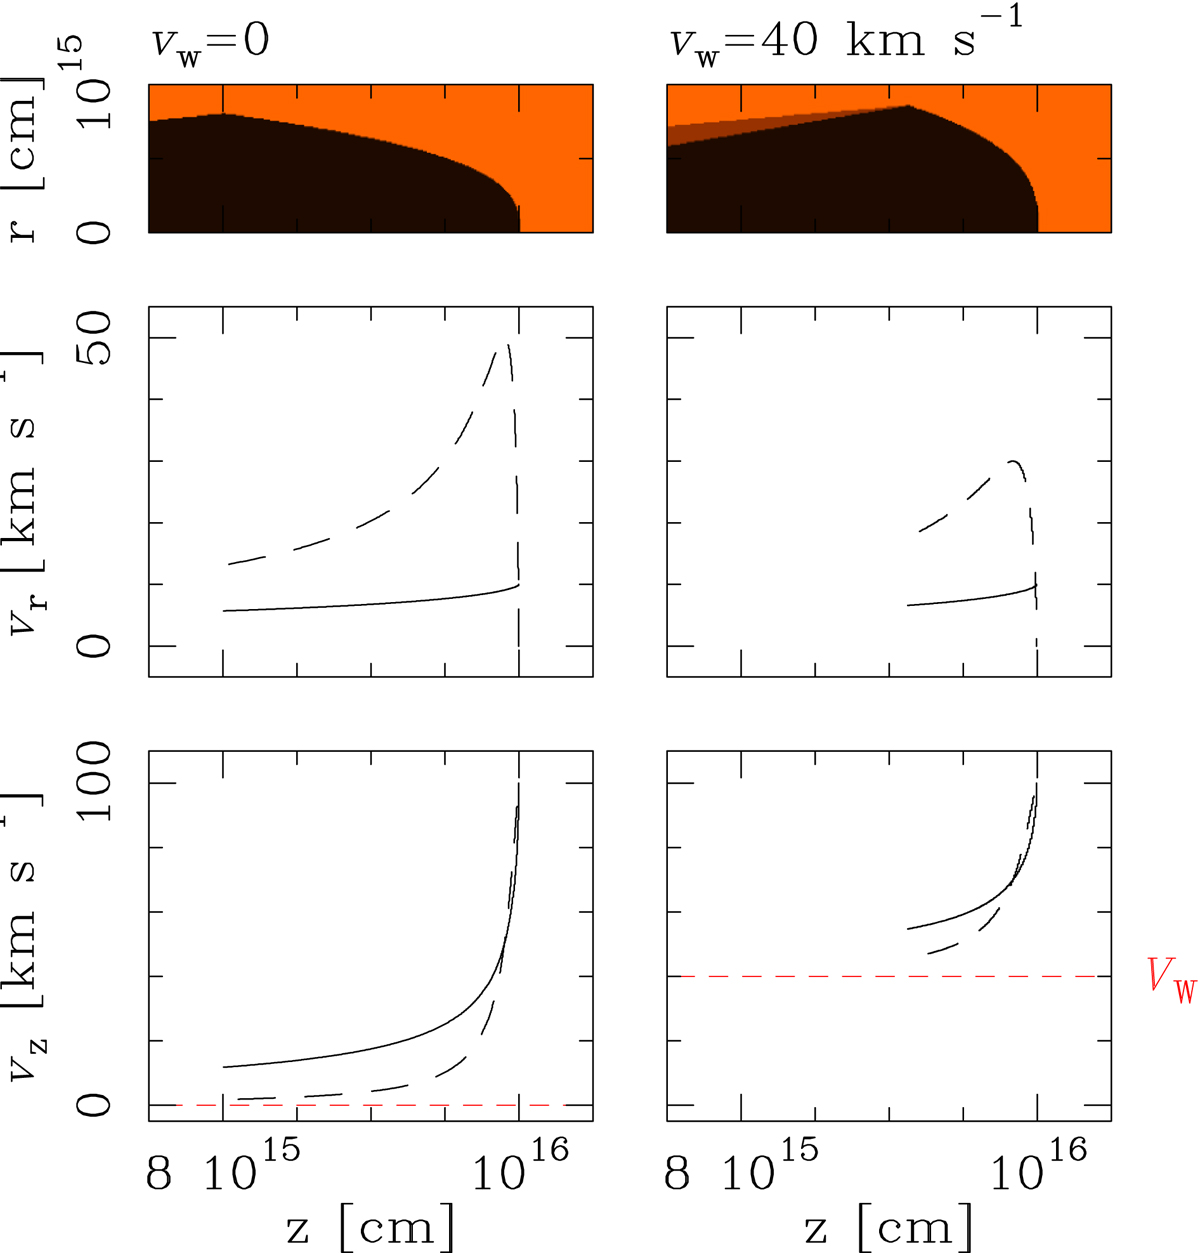
Shape of the bow shock and the cavity (top), radial velocities vr (center) and axial velocities vz (bottom) for the two models discussed in the text. The solid curves show the velocities of the well-mixed material within the thin shell flow, and the dashed curves show the immediate post-bow shock velocities. The dotted red line shows vz = vw.
Current usage metrics show cumulative count of Article Views (full-text article views including HTML views, PDF and ePub downloads, according to the available data) and Abstracts Views on Vision4Press platform.
Data correspond to usage on the plateform after 2015. The current usage metrics is available 48-96 hours after online publication and is updated daily on week days.
Initial download of the metrics may take a while.