Fig. 10
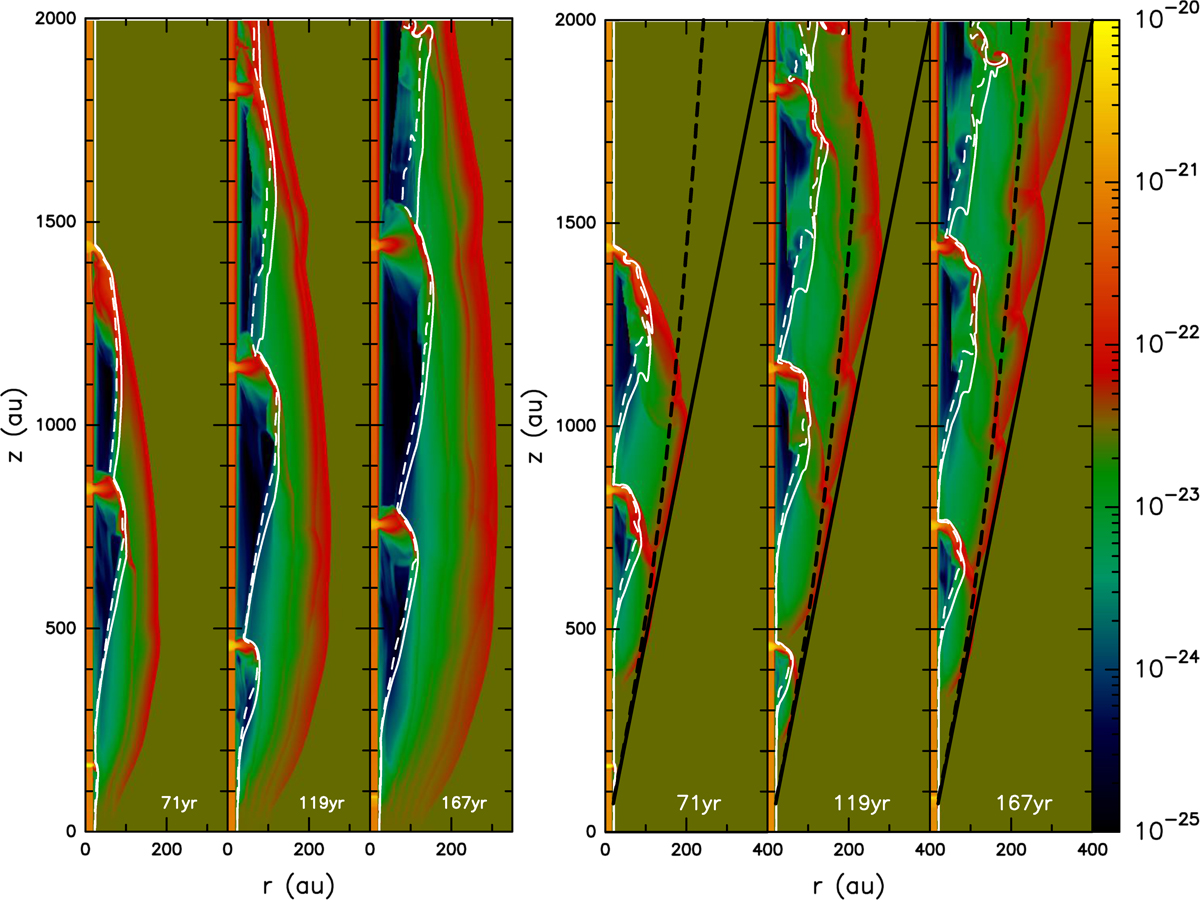
Density maps for the no-DW reference simulation (three frames on the left) and the DW simulation (three frames on the right) at t = 71, 119, and 167 yr. The white contours indicate the surface of 50% (solid line) and 90% (dashed line) jet material mixing fractions. The black lines in the disk-wind simulation show a cone of α = 11° opening half-angle, which circumscribes the boundary the region perturbed by the jet and its IWS. The black dashed lines show the predicted trajectory of the edge of the bow shock (see Eq. (14)). The density color scale is given by the right bar (in g cm−3).
Current usage metrics show cumulative count of Article Views (full-text article views including HTML views, PDF and ePub downloads, according to the available data) and Abstracts Views on Vision4Press platform.
Data correspond to usage on the plateform after 2015. The current usage metrics is available 48-96 hours after online publication and is updated daily on week days.
Initial download of the metrics may take a while.