Fig. 3.
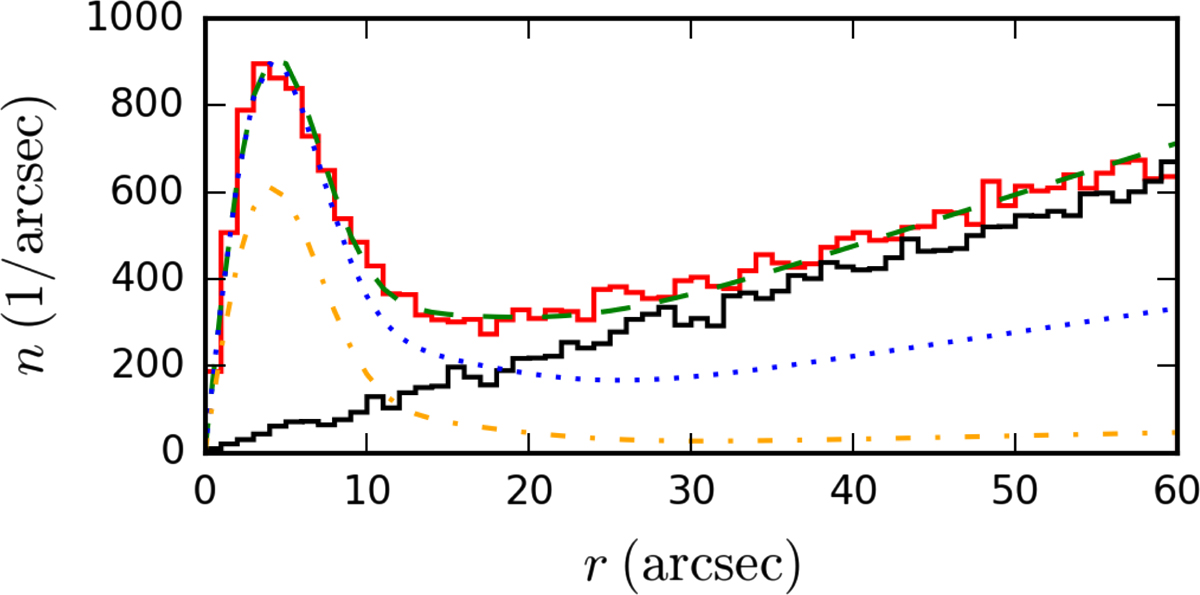
Distribution of the distances between the XMMSL2 sources and the stellar counterparts. The red solid line represents a histogram of the distances between the XMMSL2 sources and the Gaia counterparts. The black solid line represents a histogram of the distances between the randomly generated sources and the Gaia counterparts. The dashed and dotted curves represent the best fits of Eq. (1) for the different catalogs with the parameters of Table 1. The green dashed curve represents the Gaia catalog, the blue dotted curve represents the 2MASS catalog, and the orange dash-dotted curve represents the Tycho2 catalog.
Current usage metrics show cumulative count of Article Views (full-text article views including HTML views, PDF and ePub downloads, according to the available data) and Abstracts Views on Vision4Press platform.
Data correspond to usage on the plateform after 2015. The current usage metrics is available 48-96 hours after online publication and is updated daily on week days.
Initial download of the metrics may take a while.