Fig. 16.
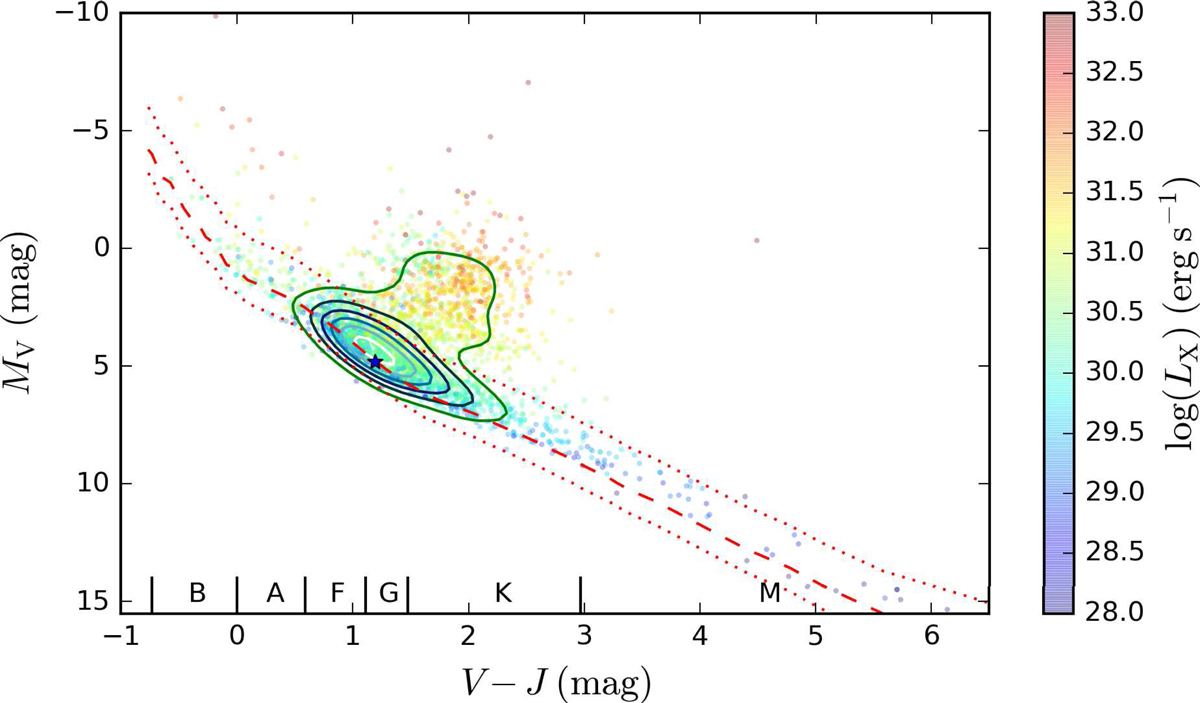
Hertzsprung-Russell diagram of the stellar XMMSL2 sources with known parallax,the color scales with the logarithmic X-ray luminosity log(L x). The red dashed line represents the theoretical main sequence following Pecaut & Mamajek (2013), and the dotted lines show the assumed width of the main sequence. The star marker represents the position of the Sun; we note that the Sun is less luminous than the stellar XMMSL2 sources. The density of the distribution is indicated by the colored lines. The ranges of the spectral types for dwarfs are given at the bottom of the figure.
Current usage metrics show cumulative count of Article Views (full-text article views including HTML views, PDF and ePub downloads, according to the available data) and Abstracts Views on Vision4Press platform.
Data correspond to usage on the plateform after 2015. The current usage metrics is available 48-96 hours after online publication and is updated daily on week days.
Initial download of the metrics may take a while.