Fig. 15.
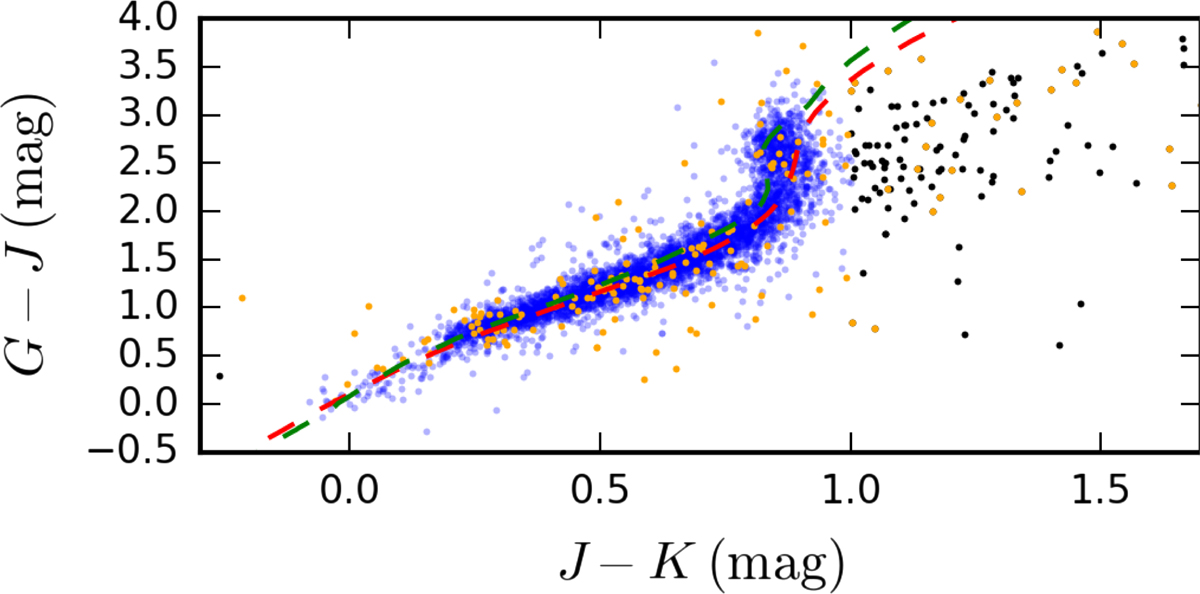
Color-color diagram of the stellar XMMSL2 sources with Gaia and 2MASS counterparts. The sources represented as orange and black dots are flagged because of their known erroneous 2MASS photometry and their unusual colors, respectively. The red and green dashed curves represent various theoretical models of the main sequence; see text for details.
Current usage metrics show cumulative count of Article Views (full-text article views including HTML views, PDF and ePub downloads, according to the available data) and Abstracts Views on Vision4Press platform.
Data correspond to usage on the plateform after 2015. The current usage metrics is available 48-96 hours after online publication and is updated daily on week days.
Initial download of the metrics may take a while.