Fig. 14.
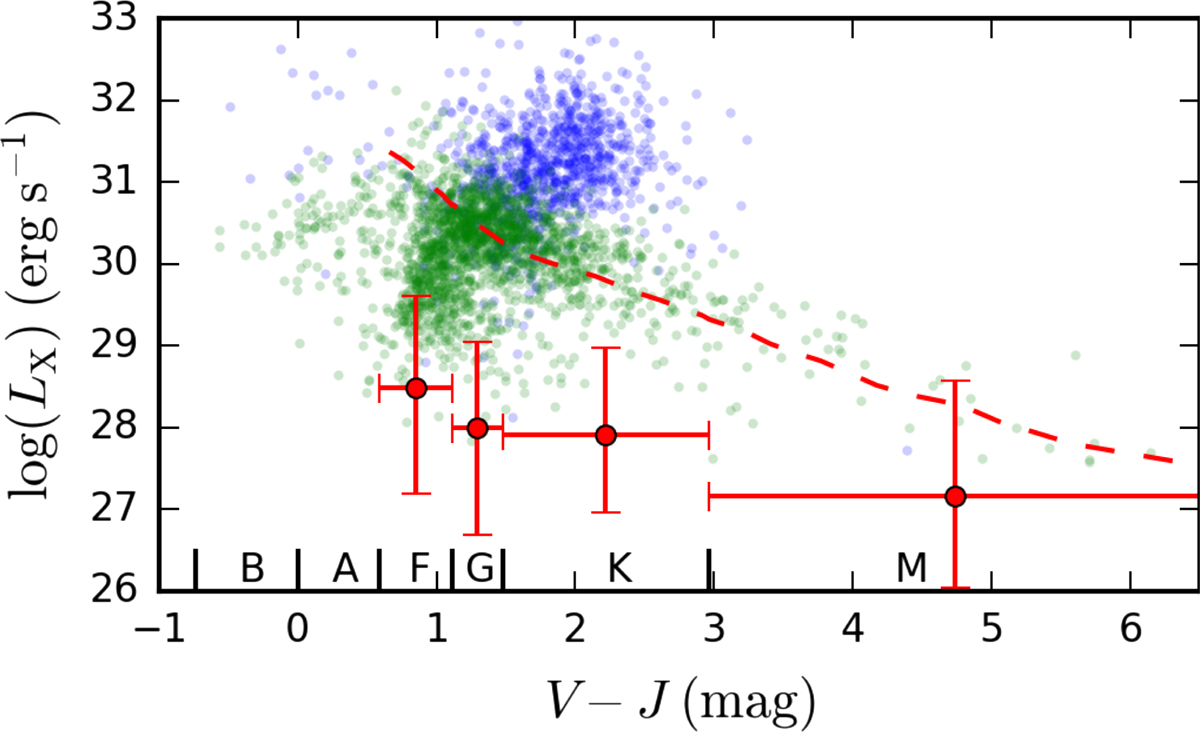
X-ray luminosity distribution of the stellar XMMSL2 sources with known parallax. Main sequence stars and giants are shown as green and blue dots, respectively. The red crosses show the X-ray luminosities of the volume limited NEXXUS sample (Schmitt & Liefke 2004). The extension in x-direction corresponds to the width of the spectral type, while the extension in y-direction shows the luminosity range in which 90 % of the NEXXUS dwarfs of the specific spectral type lie. The red dashed line represents the saturation limit at Lx/Lbol = 10−3 for dwarfs.
Current usage metrics show cumulative count of Article Views (full-text article views including HTML views, PDF and ePub downloads, according to the available data) and Abstracts Views on Vision4Press platform.
Data correspond to usage on the plateform after 2015. The current usage metrics is available 48-96 hours after online publication and is updated daily on week days.
Initial download of the metrics may take a while.