Free Access
Fig. 12.
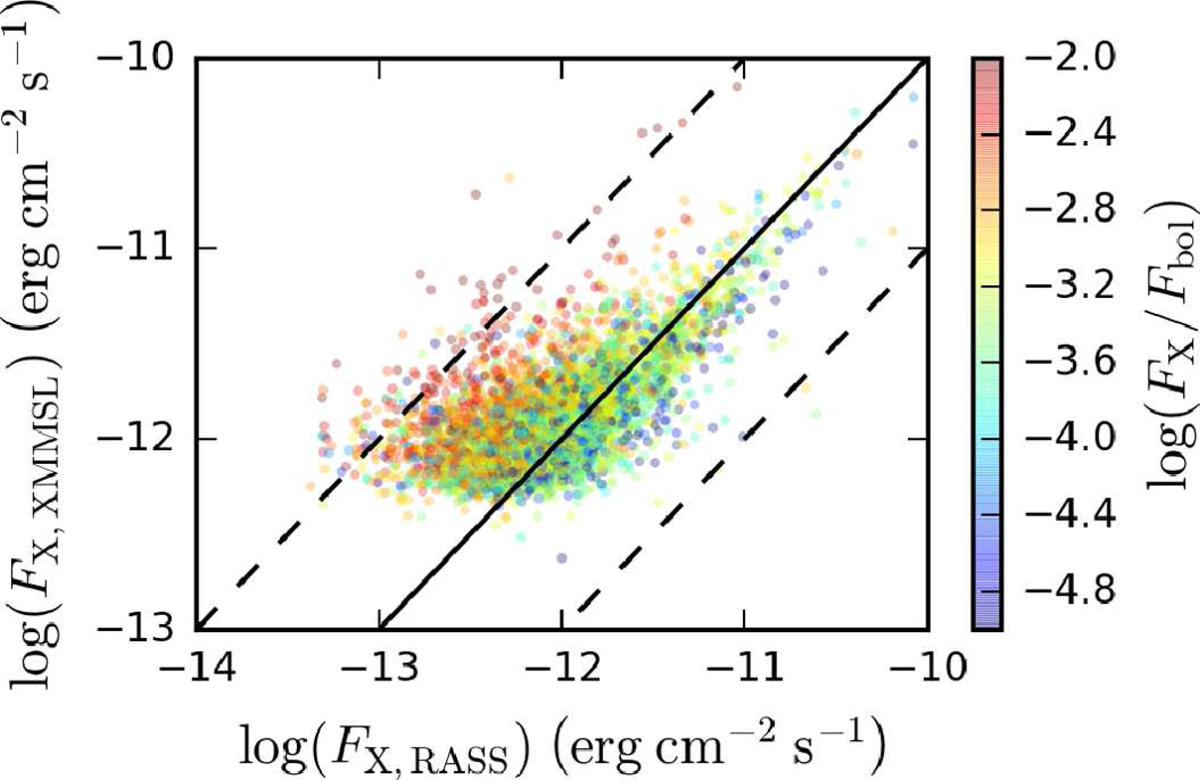
Comparison of the X-ray fluxes measured by XMM-Newton and ROSAT. Solid line indicates the same X-ray flux in the XMMSL2 and RASS catalogs, dashed lines indicate flux difference of a factor of ten. The color scales with the stellar X-ray activity measured by XMM-Newton.
Current usage metrics show cumulative count of Article Views (full-text article views including HTML views, PDF and ePub downloads, according to the available data) and Abstracts Views on Vision4Press platform.
Data correspond to usage on the plateform after 2015. The current usage metrics is available 48-96 hours after online publication and is updated daily on week days.
Initial download of the metrics may take a while.