Fig. 2
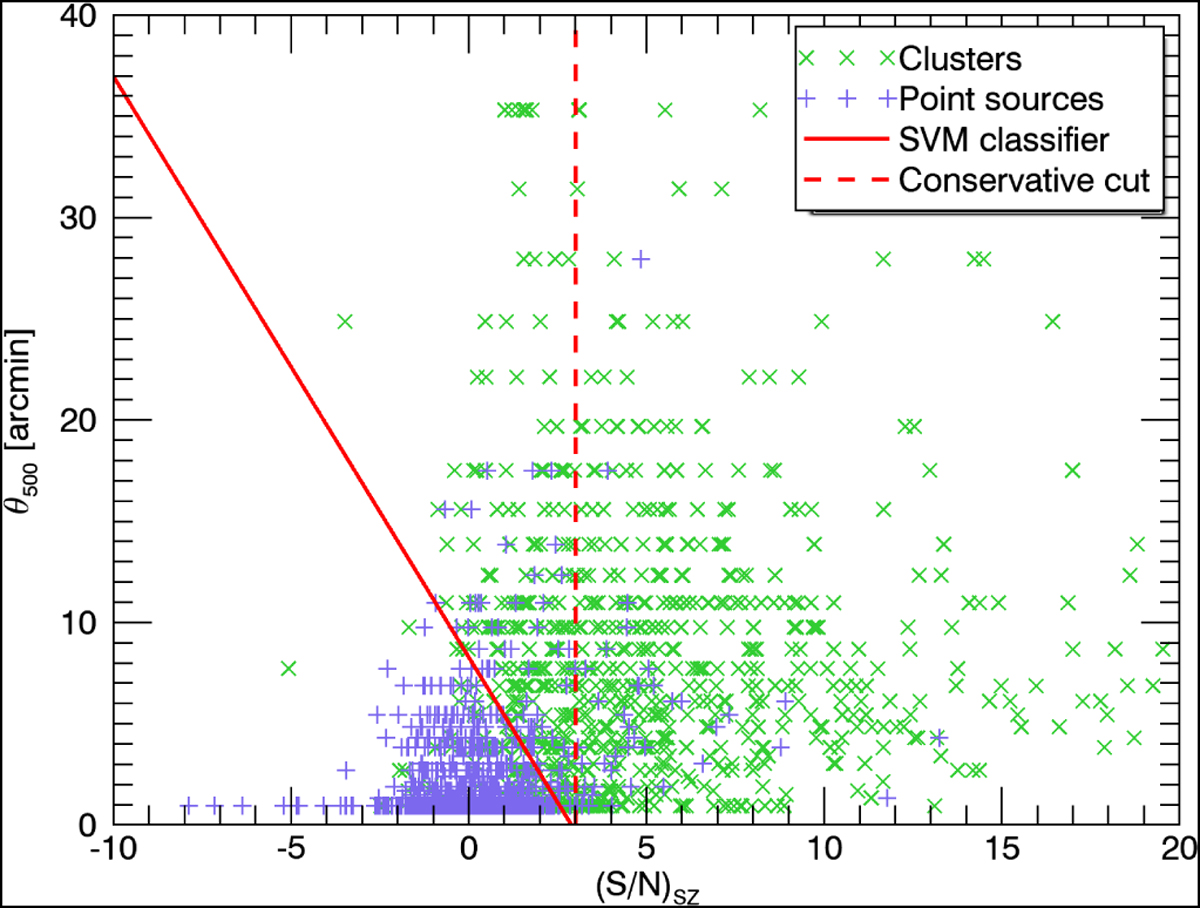
Estimated (S/N)sz and size θ500 of the joint detections in the northern hemisphere that match a known cluster or a known X-ray point source. The continuous red line shows the classification boundary provided by a SVM classifier trained with this dataset. The dashed red line shows the conservative cut that we adopted for discarding point sources.
Current usage metrics show cumulative count of Article Views (full-text article views including HTML views, PDF and ePub downloads, according to the available data) and Abstracts Views on Vision4Press platform.
Data correspond to usage on the plateform after 2015. The current usage metrics is available 48-96 hours after online publication and is updated daily on week days.
Initial download of the metrics may take a while.