Fig. 13
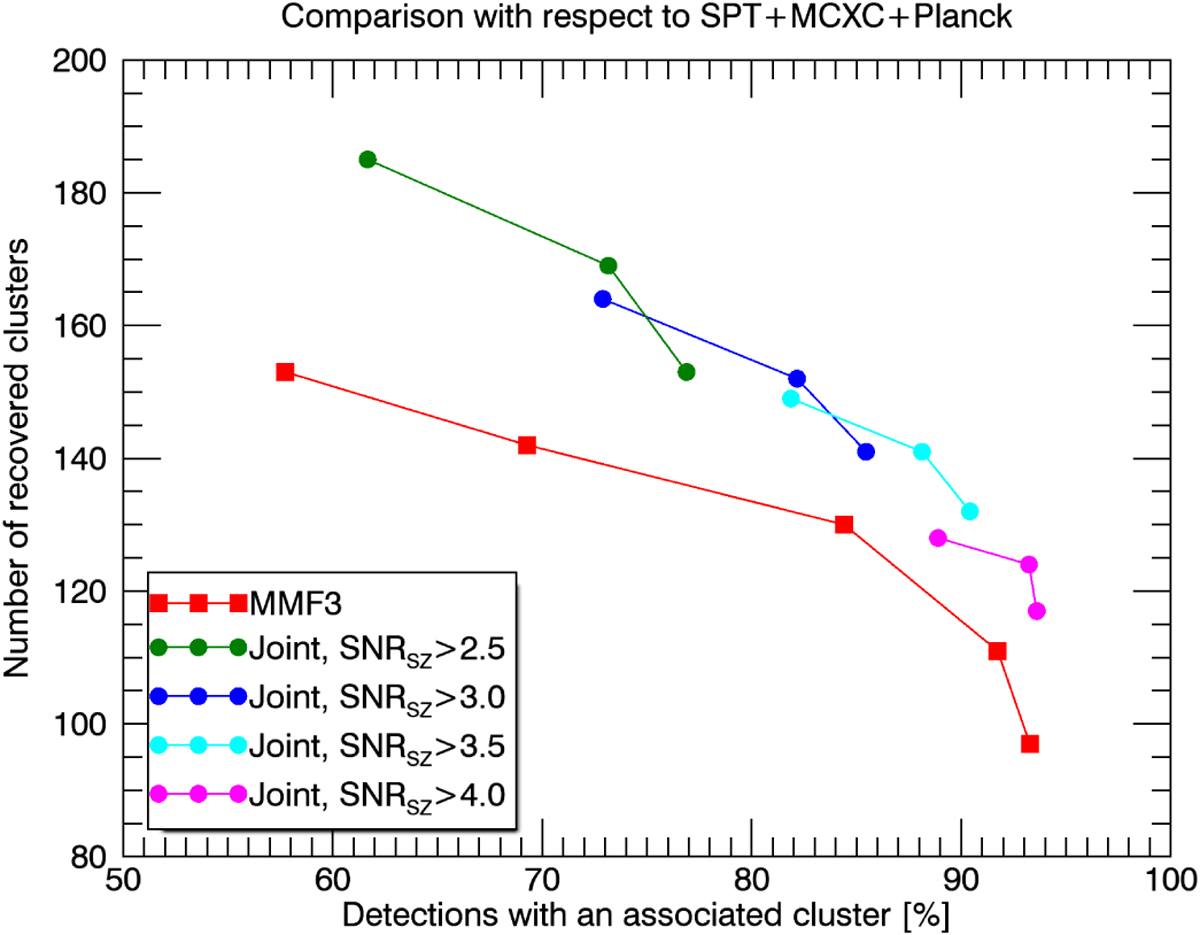
Comparison of the performance of the proposed method (green, blue, cyan, and magenta circles) and the MMF3 method (red squares). The horizontal axis shows the percentage of detections which match a real cluster within a 10 arcmin radius. It is an indicator of the purity of the methods. The vertical axis shows the number of real clusters detected (which match a detection within a 10 arcmin radius). It is related to the detection efficiency of the methods. We assume thatthe real clusters in the considered region are all the clusters from the SPT, MCXC, and Planck catalogues with known mass and redshift (confirmed). The different points in the curves correspond to different operational points of the detection algorithms. For the MMF3 case we have represented the results for S/N thresholds of 4.00, 4.25, 4.50, 4.75, and 5.00, increasing from left to right. For the proposed algorithm, we have represented the results for PFA =3.40 × 10⁻⁶, PFA =2.04 × 10⁻⁷ and PFA = 1.90 × 10⁻⁸, decreasing from left to right for each (S/N)sz cut.
Current usage metrics show cumulative count of Article Views (full-text article views including HTML views, PDF and ePub downloads, according to the available data) and Abstracts Views on Vision4Press platform.
Data correspond to usage on the plateform after 2015. The current usage metrics is available 48-96 hours after online publication and is updated daily on week days.
Initial download of the metrics may take a while.