Fig. 10
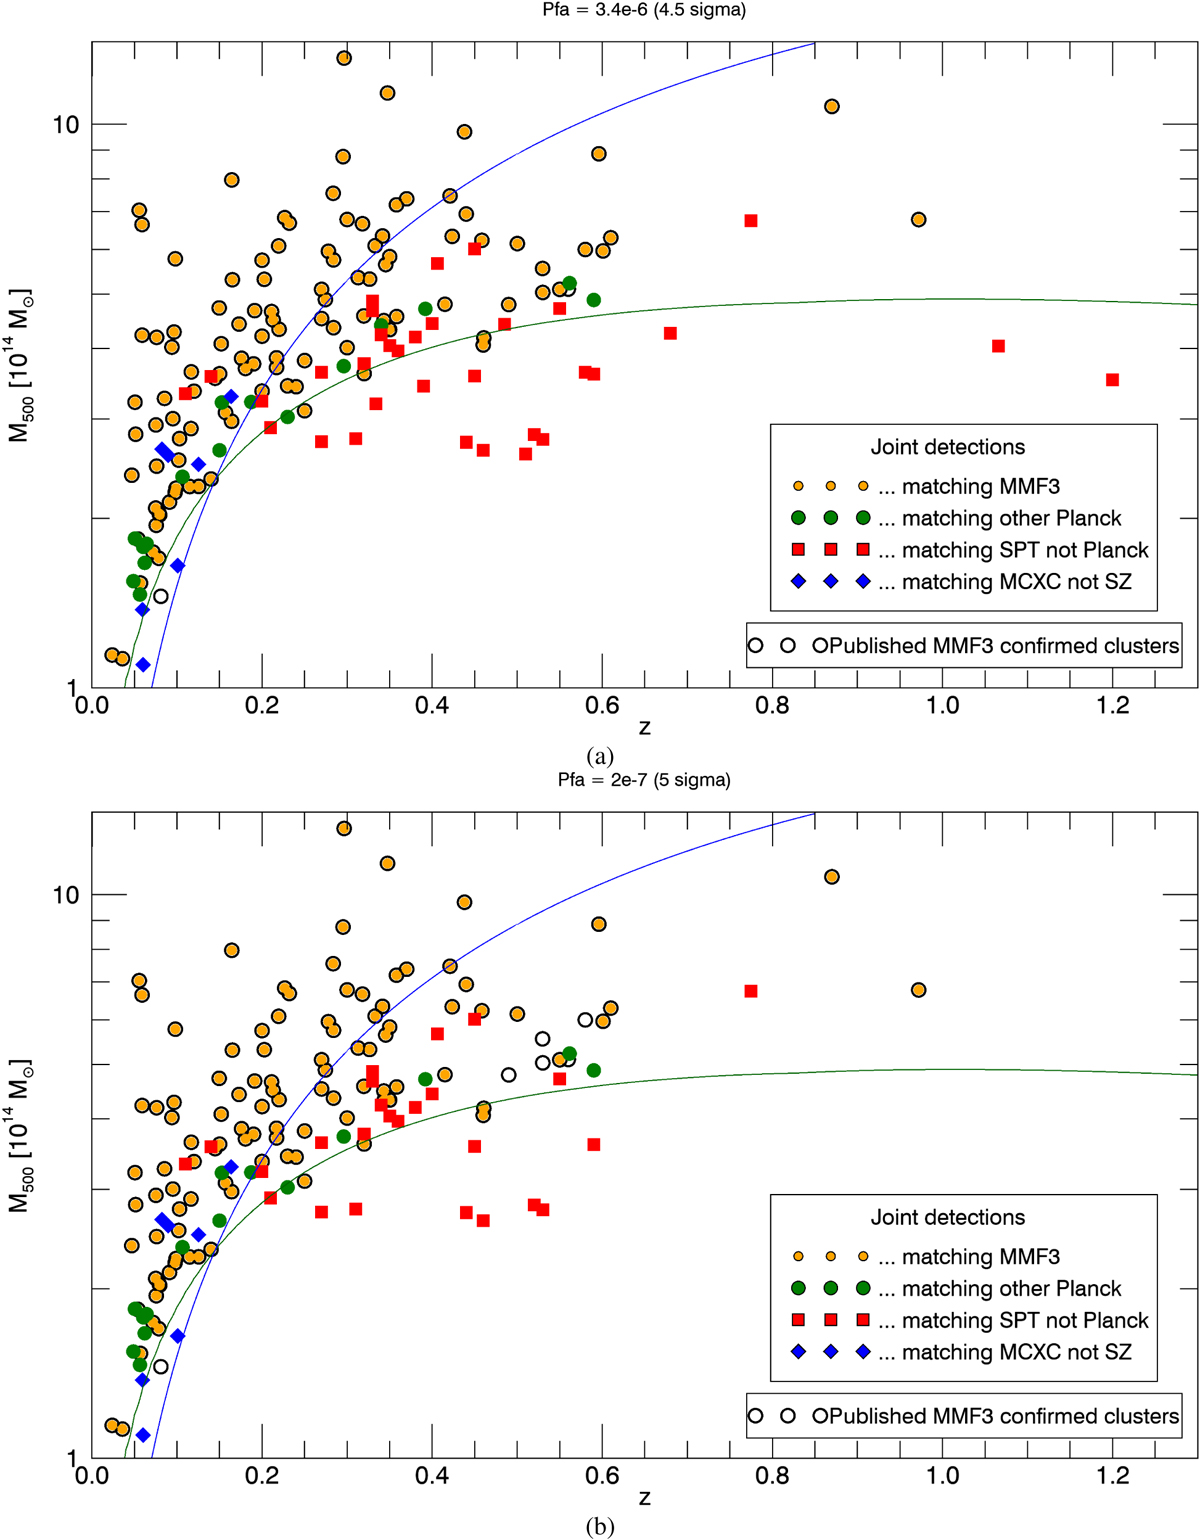
Massand redshift of the clusters in the MMF3 catalogue and of the clusters detected with the proposed method for (a) PFA = 3.40 × 10⁻⁶ and (b) PFA = 2.04 × 10⁻⁷. Open circles represent the MMF3 confirmed clusters in the considered region, while filled symbols represent the joint detections colour-coded according to the associated cluster. Yellow filled circles represent joint detections matching confirmed MMF3 clusters, green filled circles represent joint detections matching other confirmed Planck clusters (not MMF3), red squares represent joint detections matching confirmed SPT clusters not detected by Planck, and blue diamonds represent joint detections matching confirmed MCXC clusters that do not match any of the previously mentioned catalogues. The blue solid line shows the REFLEX detection limit, calculated from the REFLEX flux limit and the LX − M500 relation presented in Piffaretti et al. (2011). It corresponds to a completeness of at least 90% (Böhringer et al. 2001). The green solid line shows the Planck mass limit for the SPT zone at 20% completeness.
Current usage metrics show cumulative count of Article Views (full-text article views including HTML views, PDF and ePub downloads, according to the available data) and Abstracts Views on Vision4Press platform.
Data correspond to usage on the plateform after 2015. The current usage metrics is available 48-96 hours after online publication and is updated daily on week days.
Initial download of the metrics may take a while.