Fig. 6
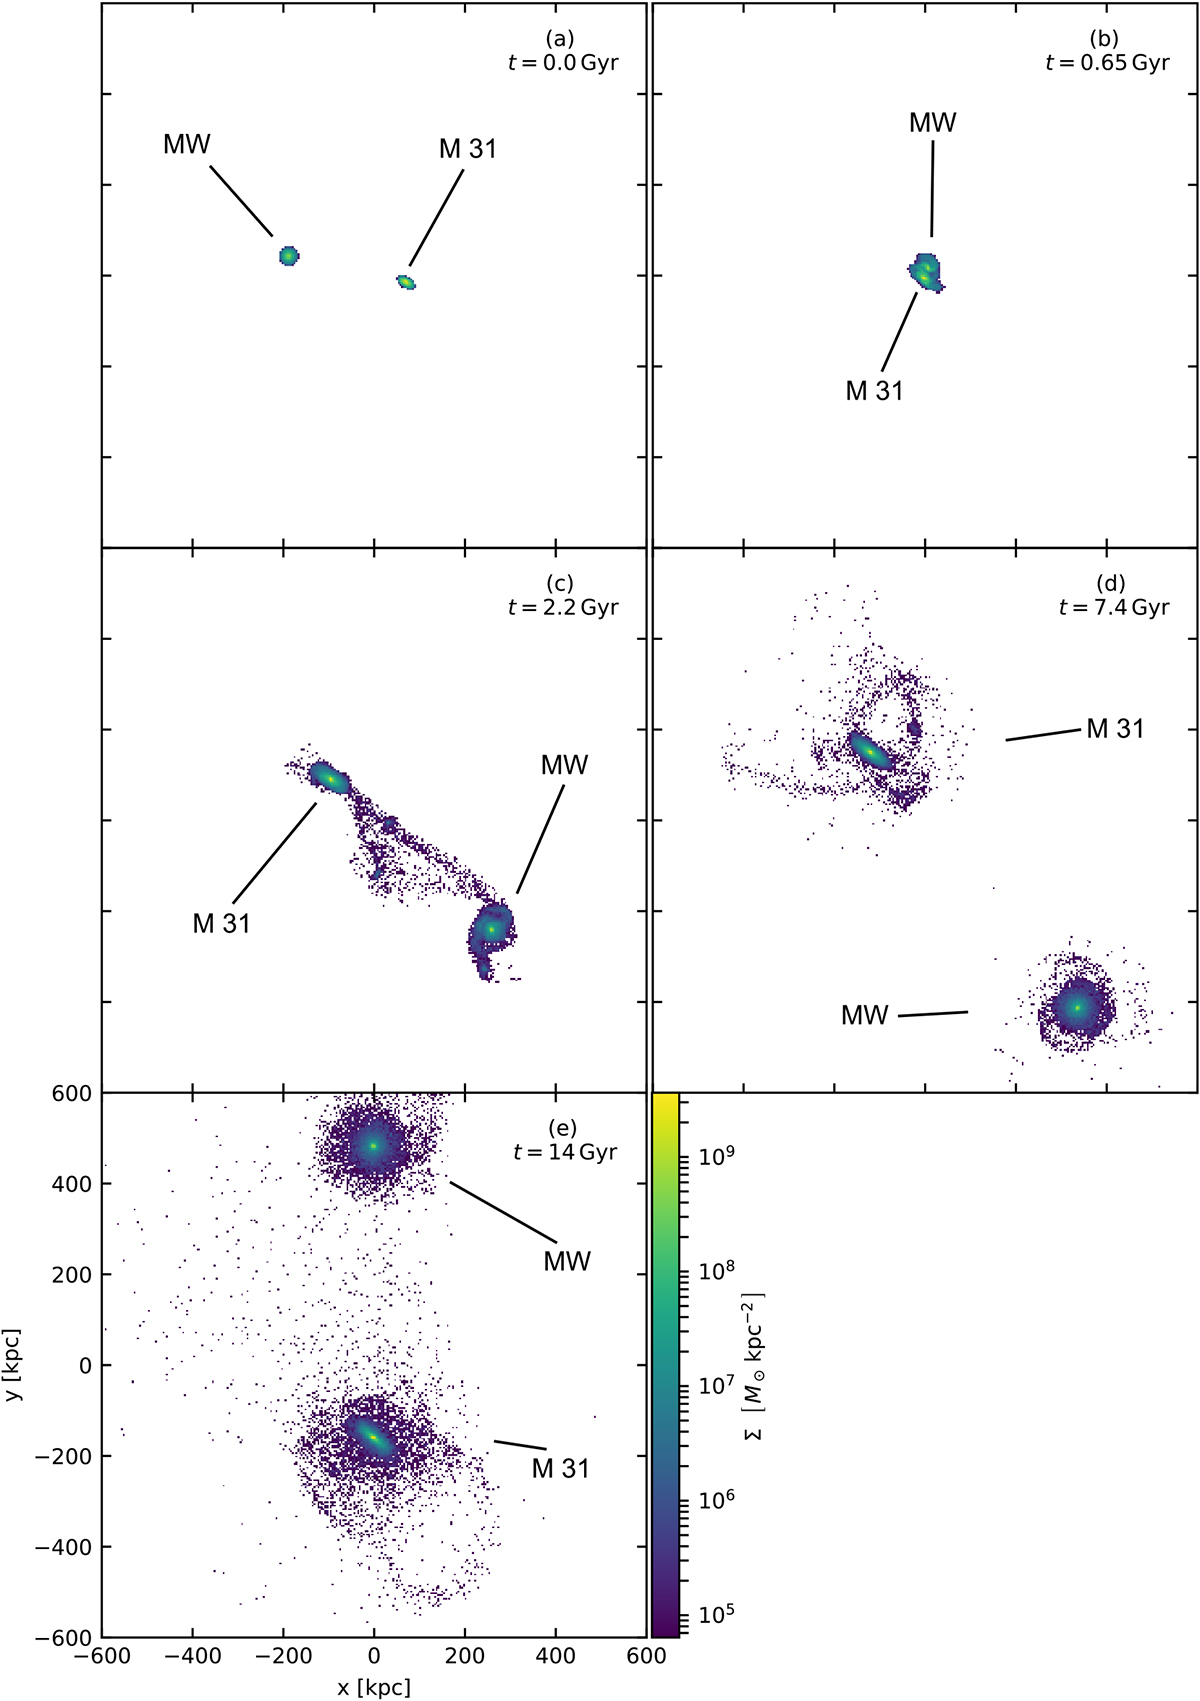
Simulation snapshots. Projection along the Z-axis. The time since the beginning of the simulation is marked. Panel a: simulation starts. Panel b: galaxies are in the relative pericenter. Panel c: matter is being transferred from the MW to M 31. Panel d: the current time (the observed state is reproduced). Panel e: simulation ends.
Current usage metrics show cumulative count of Article Views (full-text article views including HTML views, PDF and ePub downloads, according to the available data) and Abstracts Views on Vision4Press platform.
Data correspond to usage on the plateform after 2015. The current usage metrics is available 48-96 hours after online publication and is updated daily on week days.
Initial download of the metrics may take a while.