Fig. 17
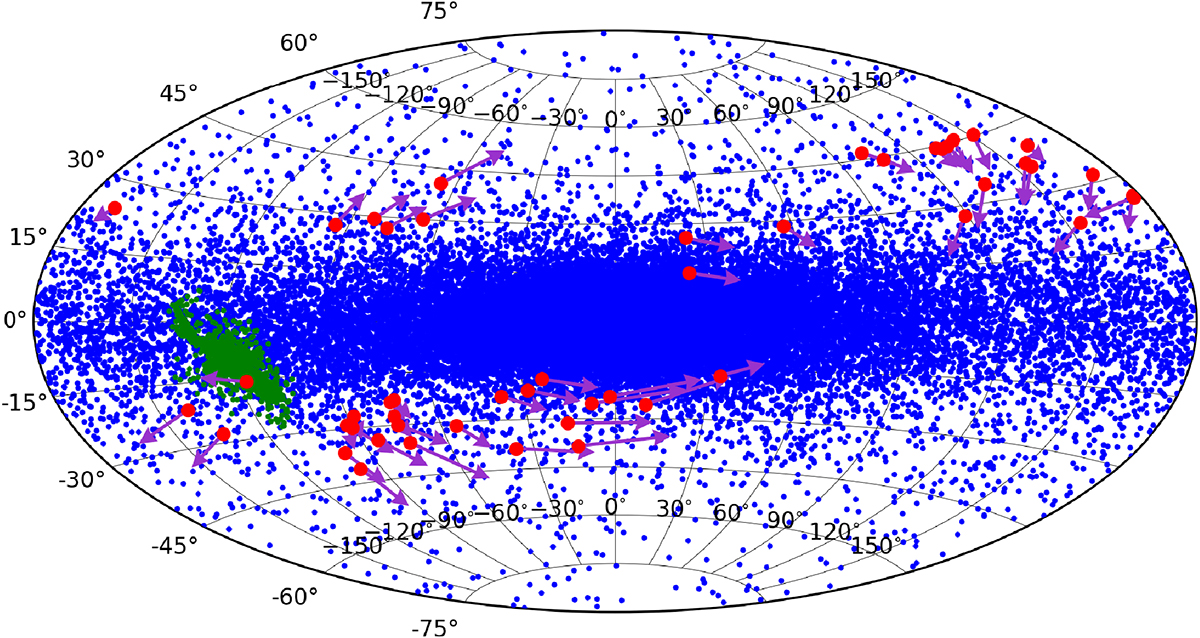
Aitoff projection of all particles in the simulation seen from the position of the Sun in the Galactic coordinate system. TheM 31 particles are shown in green. The particles belonging to MW and farther than 50 kpc from the MW disk plane are plotted in red. The other MW particles are shown in blue. The arrows show the proper motions of the red particles as observed from the Sun in the simulation. This figure can be compared to Fig. 1 of Pawlowski et al. (2015b).
Current usage metrics show cumulative count of Article Views (full-text article views including HTML views, PDF and ePub downloads, according to the available data) and Abstracts Views on Vision4Press platform.
Data correspond to usage on the plateform after 2015. The current usage metrics is available 48-96 hours after online publication and is updated daily on week days.
Initial download of the metrics may take a while.