Free Access
Fig. 13
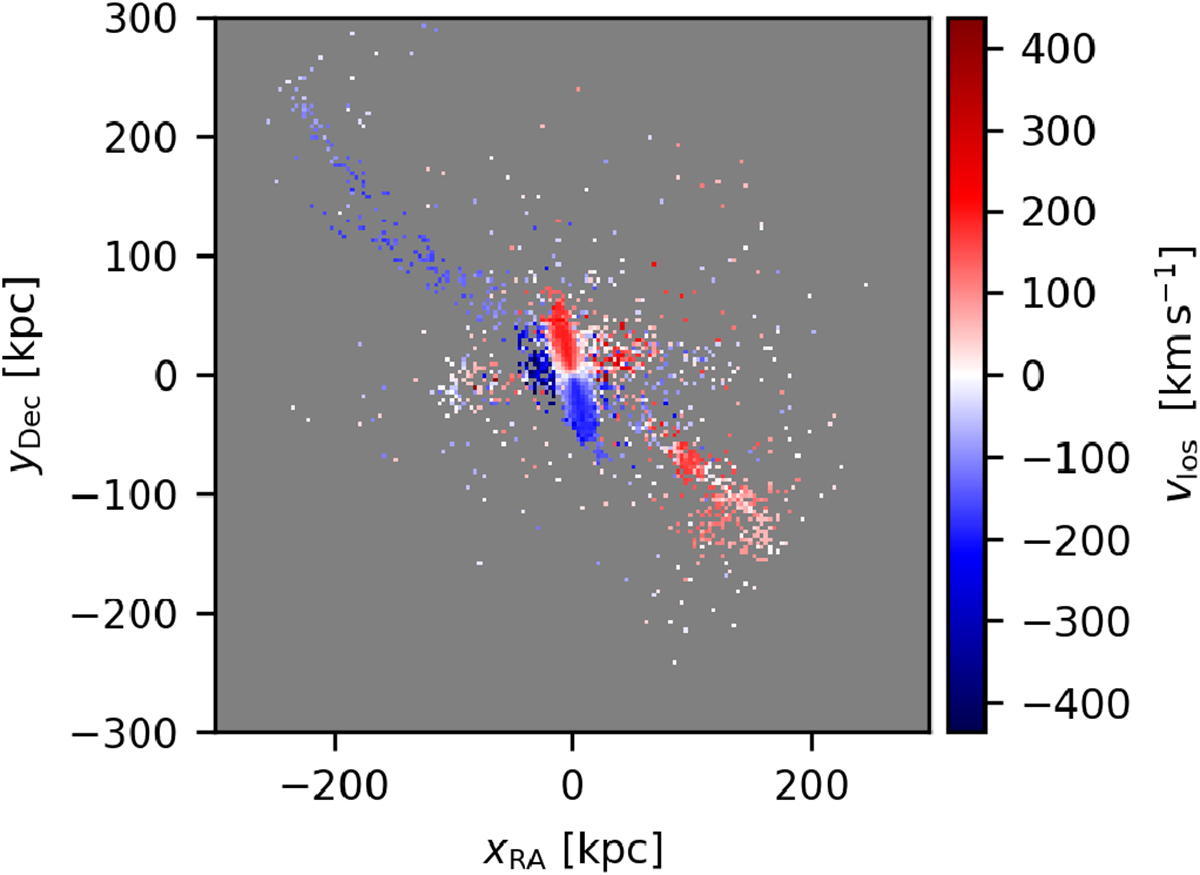
Viewof M 31 from the Sun in the simulation. The color codes the average line-of-sight velocity with the systemic velocity subtracted. Note the pronounced linear feature resembling the GPoA (Fig. 14) and the dissolving satellite in the right part (better visible in Fig. 8) similar to the dissolving satellite in Fig. 15.
Current usage metrics show cumulative count of Article Views (full-text article views including HTML views, PDF and ePub downloads, according to the available data) and Abstracts Views on Vision4Press platform.
Data correspond to usage on the plateform after 2015. The current usage metrics is available 48-96 hours after online publication and is updated daily on week days.
Initial download of the metrics may take a while.