Fig. A.1.
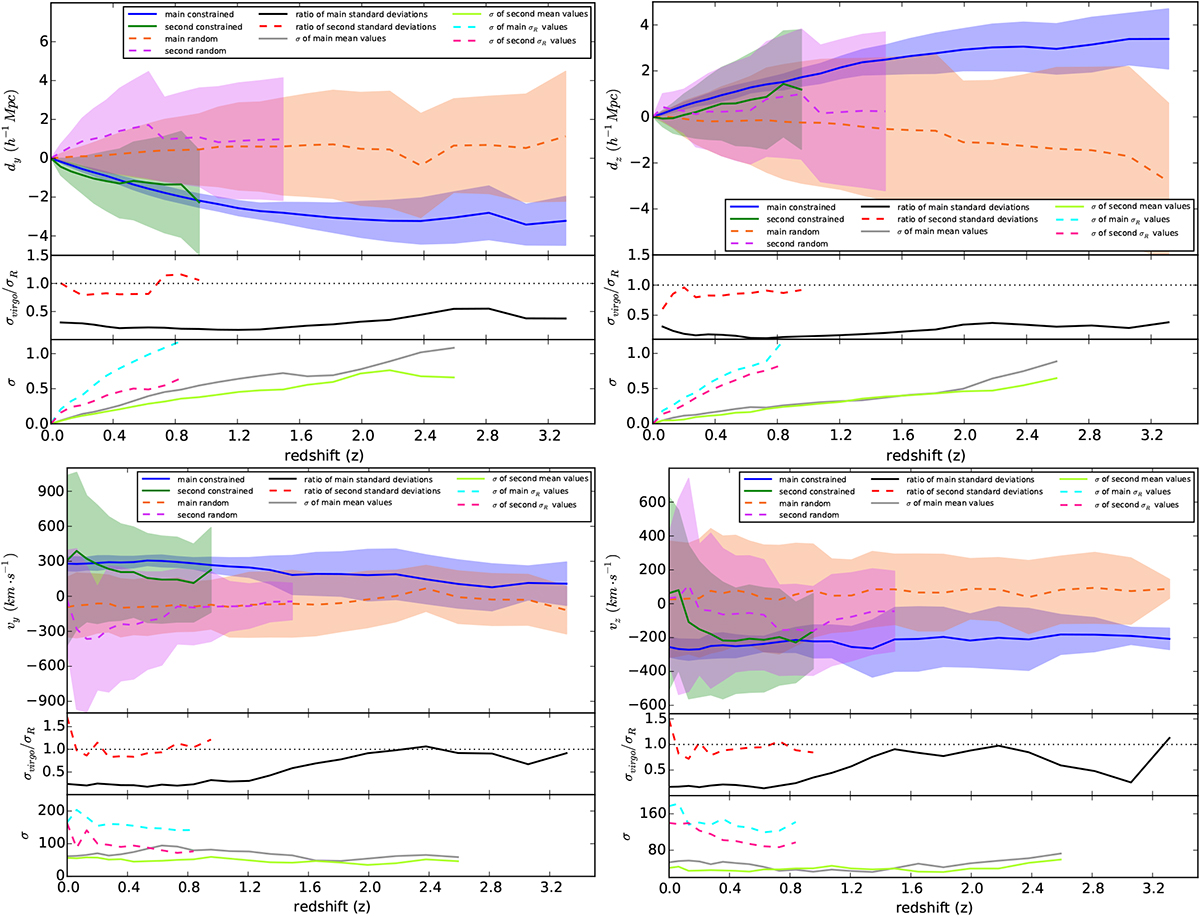
Fromleft to right, top to bottom: average y and z displacement and velocity (first row of each panel) components of the main and second progenitors of Virgo (solid blue and green lines) and random (dashed orange and violet lines) candidates. The standard deviations are shown with the transparent areas using the same color code. Second row of all the panels: ratio of the constrained to random standard deviations for the main (solid black line) and second (dashed red line) progenitors. Last row of all the panels: standard deviation of the means (main: solid gray line and second: solid light green line) and standard deviations (main: dashed light blue line and second: dashed pink line) of several sets of 15 random candidates.
Current usage metrics show cumulative count of Article Views (full-text article views including HTML views, PDF and ePub downloads, according to the available data) and Abstracts Views on Vision4Press platform.
Data correspond to usage on the plateform after 2015. The current usage metrics is available 48-96 hours after online publication and is updated daily on week days.
Initial download of the metrics may take a while.