Fig. 7
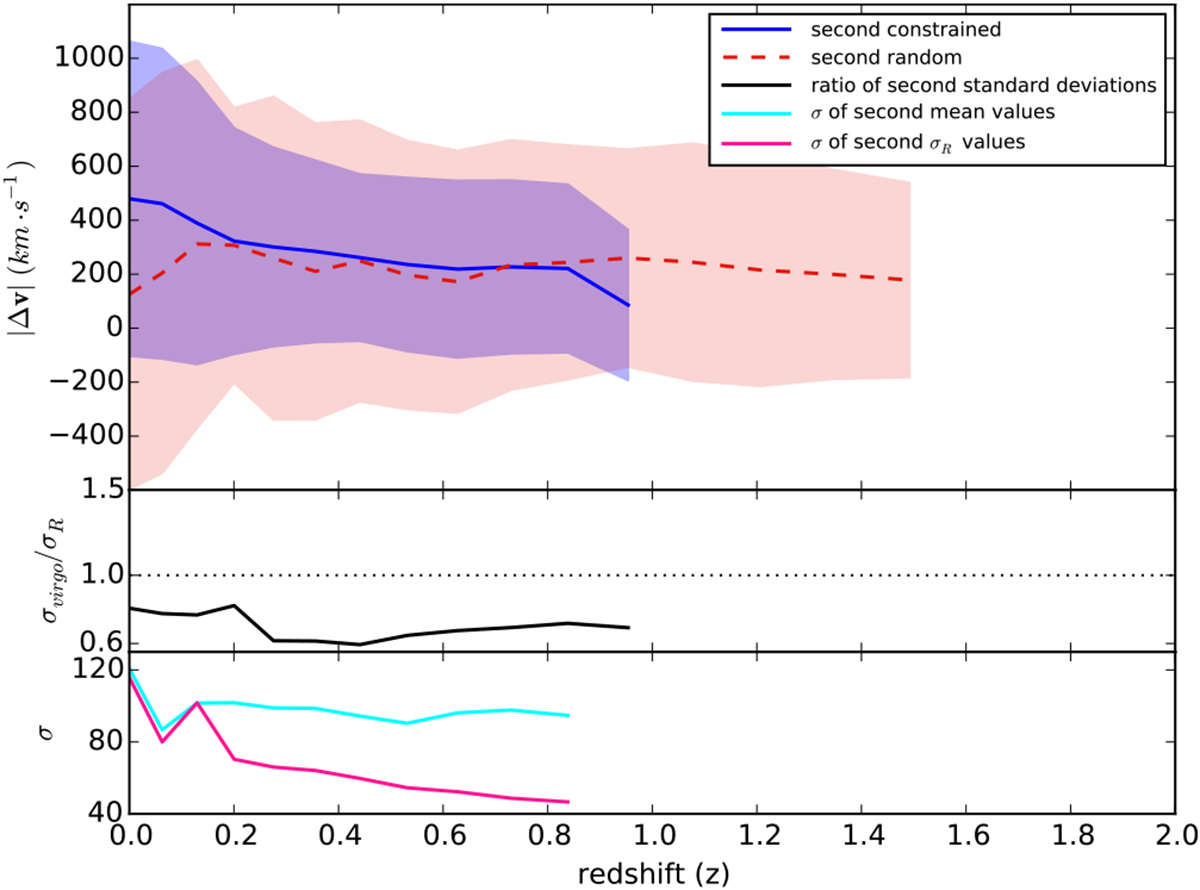
Top row: average relative velocity of the second constrained (blue solid line) and random (red dashed line) progenitors with respect to the main halo at each redshift. Middle row: ratio of the constrained to random standard deviations of the relative velocity. Bottom row: standard deviation of the means (solid light blue line) and standard deviations (solid pink line) of several sets of 15 random candidates.
Current usage metrics show cumulative count of Article Views (full-text article views including HTML views, PDF and ePub downloads, according to the available data) and Abstracts Views on Vision4Press platform.
Data correspond to usage on the plateform after 2015. The current usage metrics is available 48-96 hours after online publication and is updated daily on week days.
Initial download of the metrics may take a while.