Fig. 3
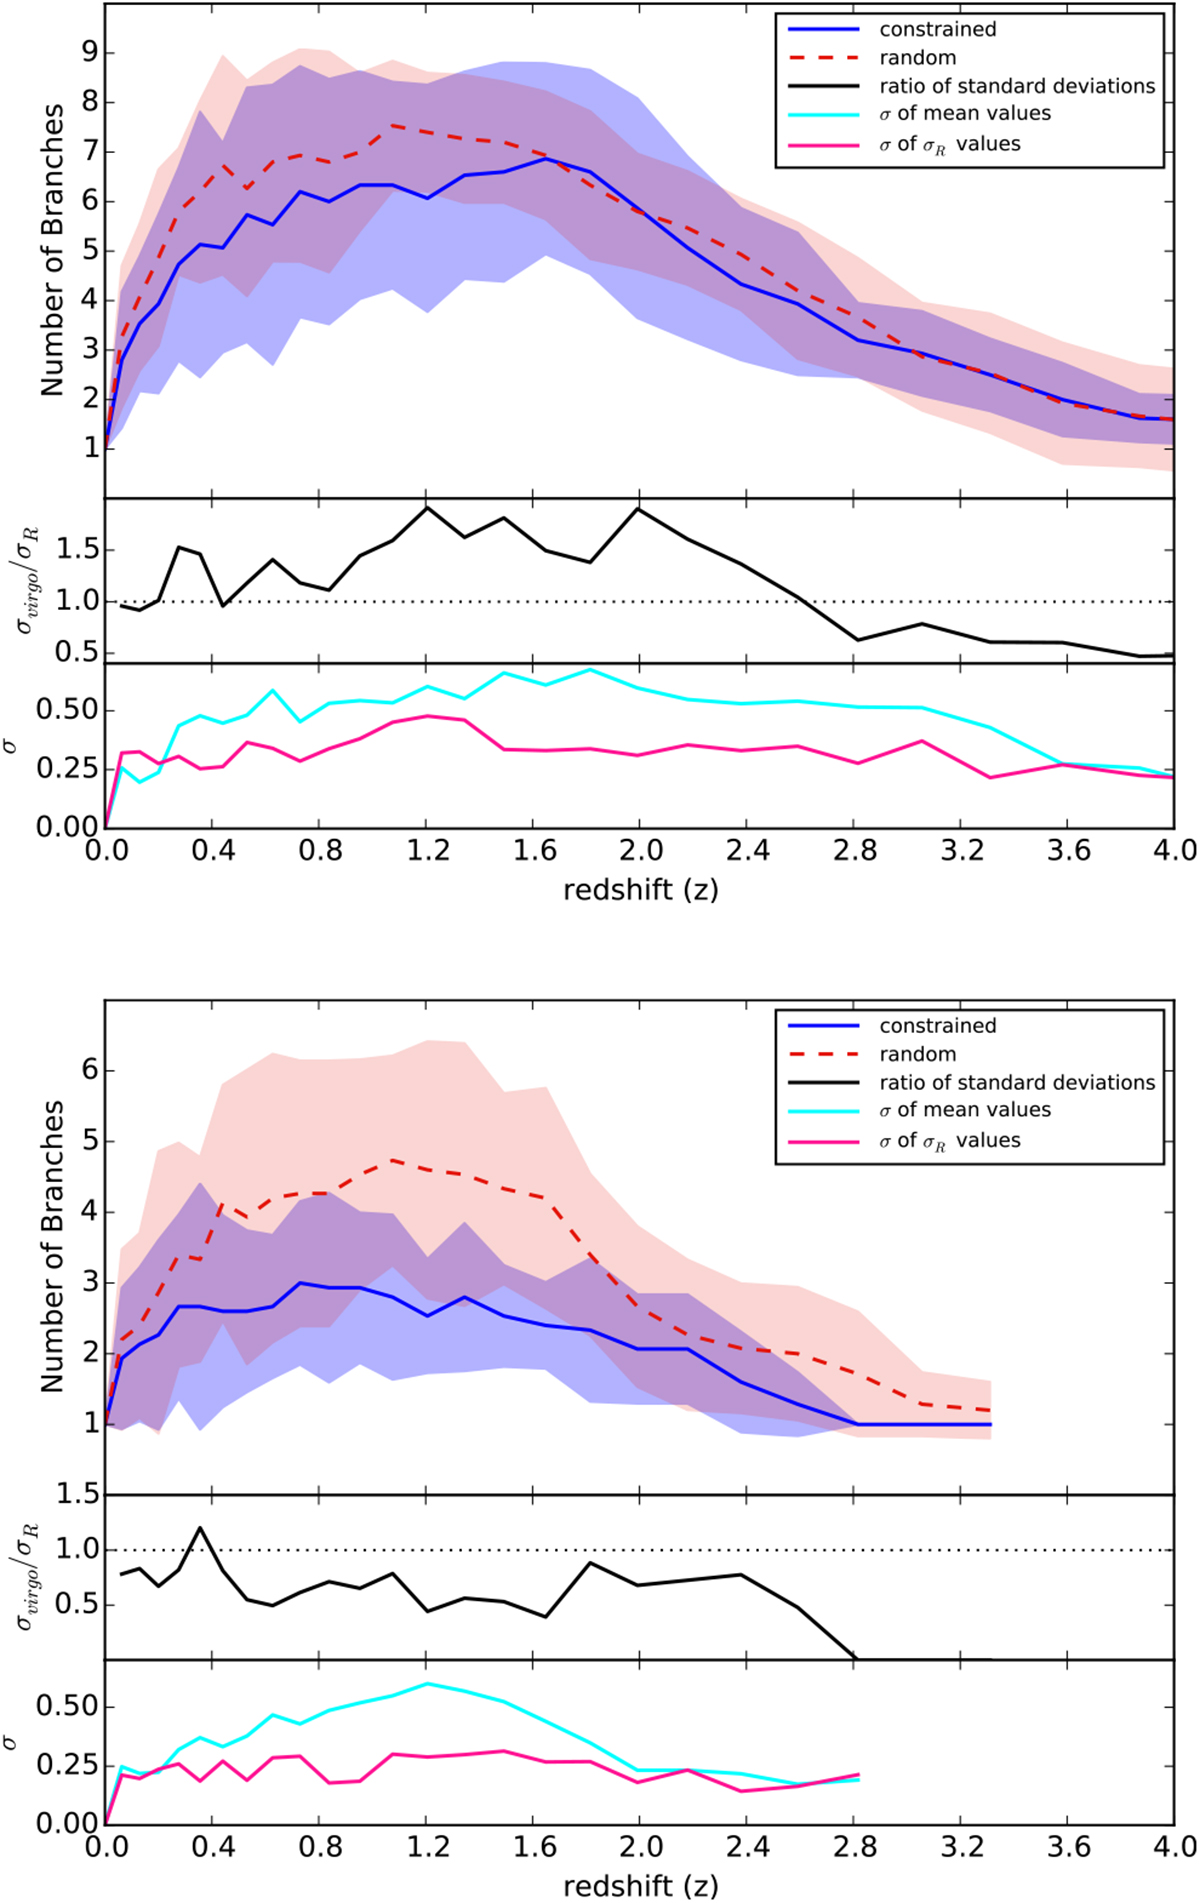
First row of both panels (solid and dashed lines): number of branches and the associated standard deviation (filled areas) for the 15 Virgo (blue) and 15 random (red) candidates. While in the top panel, every halo detected by the halo finder at each redshift is included in the count, in the bottom panel, only halos with more than 100 particles are retained. Results are identical: virgo candidates have on average a merger tree with less branches than the random ones. Second row of both panels: ratio (solid black line) of the standard deviations of the constrained to the random samples. Last row of both panels: standard deviation of the means (solid light blue line) and standard deviations (solid pink line) obtained for different sets of 15 random candidates. The low values demonstrate that the results do not depend (small variation of the mean and standard deviation from one sample to the other) on the set of 15 random halos used for the comparison.
Current usage metrics show cumulative count of Article Views (full-text article views including HTML views, PDF and ePub downloads, according to the available data) and Abstracts Views on Vision4Press platform.
Data correspond to usage on the plateform after 2015. The current usage metrics is available 48-96 hours after online publication and is updated daily on week days.
Initial download of the metrics may take a while.