Fig. 6
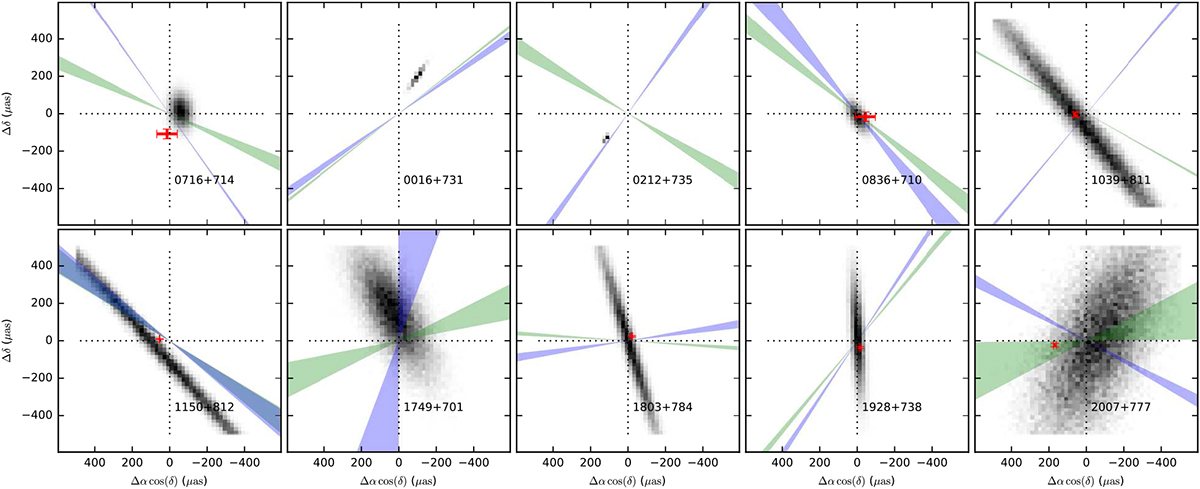
In black, 2D histograms of the core-shifts in the S5 polar cap sample estimated from the IFDPD analysis (see Sect. 4.3). In red crosses, core-shifts estimated using the SFPR technique (Martí-Vidal et al. 2016). Blue (green) shaded areas indicate the orientations (within 1σ) of the main axis of the Gaussian intensity distributions fitted to the jet cores at U (Q) band (see Sect. 4.4).
Current usage metrics show cumulative count of Article Views (full-text article views including HTML views, PDF and ePub downloads, according to the available data) and Abstracts Views on Vision4Press platform.
Data correspond to usage on the plateform after 2015. The current usage metrics is available 48-96 hours after online publication and is updated daily on week days.
Initial download of the metrics may take a while.