Free Access
Fig. 5
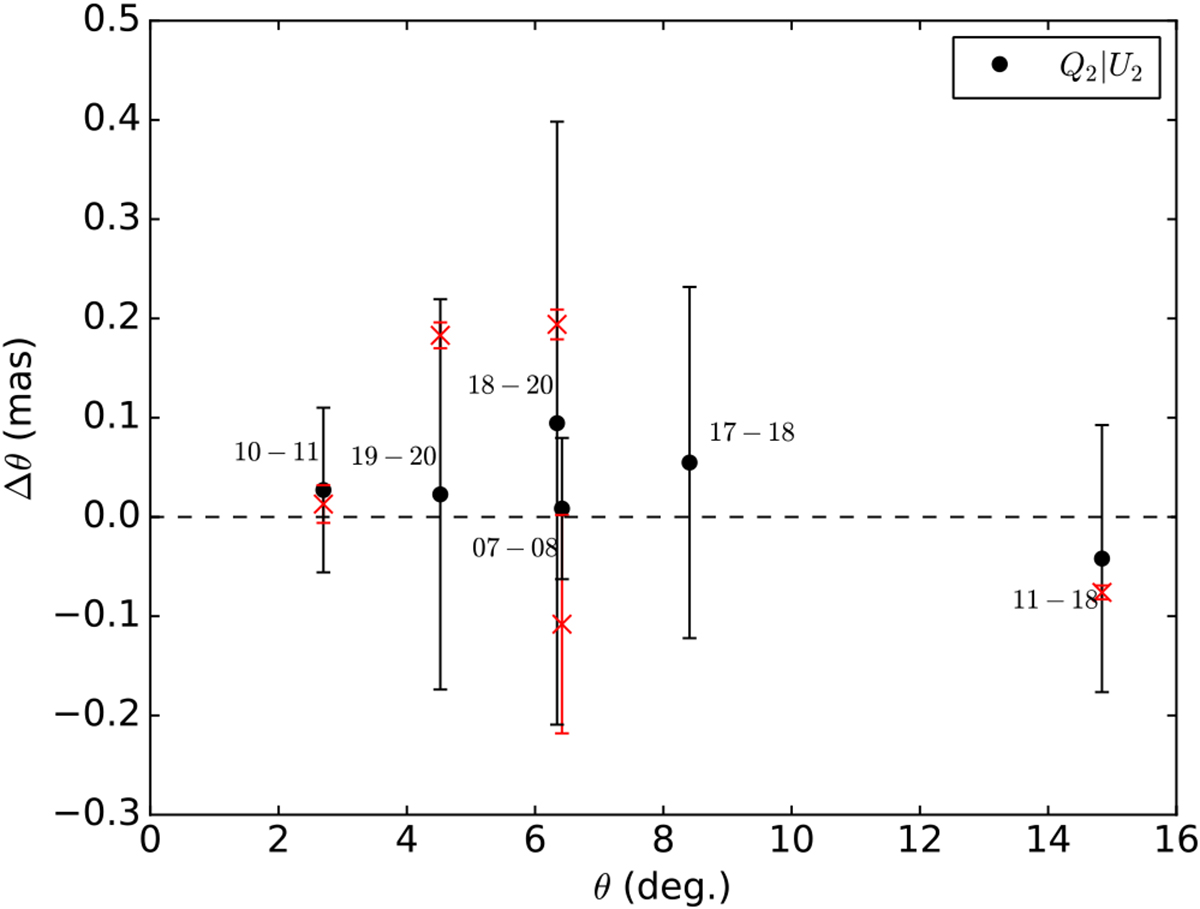
Differences in source separations between U and Q bands in 2010. The red crosses correspond to the changes in angular separations estimated from the core-shift position corrections given in Martí-Vidal et al. (2016).
Current usage metrics show cumulative count of Article Views (full-text article views including HTML views, PDF and ePub downloads, according to the available data) and Abstracts Views on Vision4Press platform.
Data correspond to usage on the plateform after 2015. The current usage metrics is available 48-96 hours after online publication and is updated daily on week days.
Initial download of the metrics may take a while.