Fig. 3
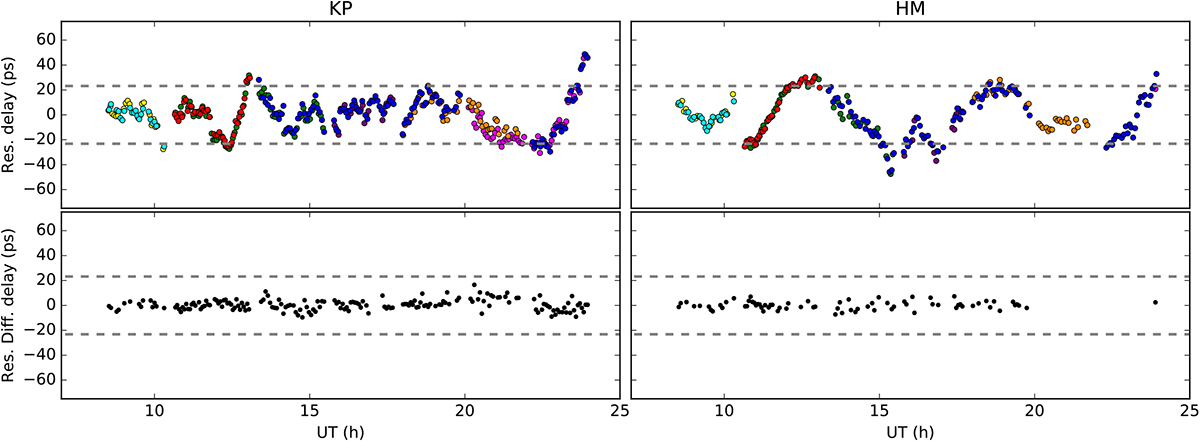
Post-fit residual phase-delays for baselines Kitt Peak–Pie Town (left) and Hancock–Mauna Kea (right) for all observed sources: undifferenced delays (top); differenced delays (bottom). The dashed lines correspond to the delays of a ± 2π phase ambiguity at 43.1 GHz. Each color represents one source in the sample. The lack of residual differenced phase-delays between 20–25 h for the baseline HM is due to low S/N data of source 20 (magenta) in that interval.
Current usage metrics show cumulative count of Article Views (full-text article views including HTML views, PDF and ePub downloads, according to the available data) and Abstracts Views on Vision4Press platform.
Data correspond to usage on the plateform after 2015. The current usage metrics is available 48-96 hours after online publication and is updated daily on week days.
Initial download of the metrics may take a while.