Fig. 8
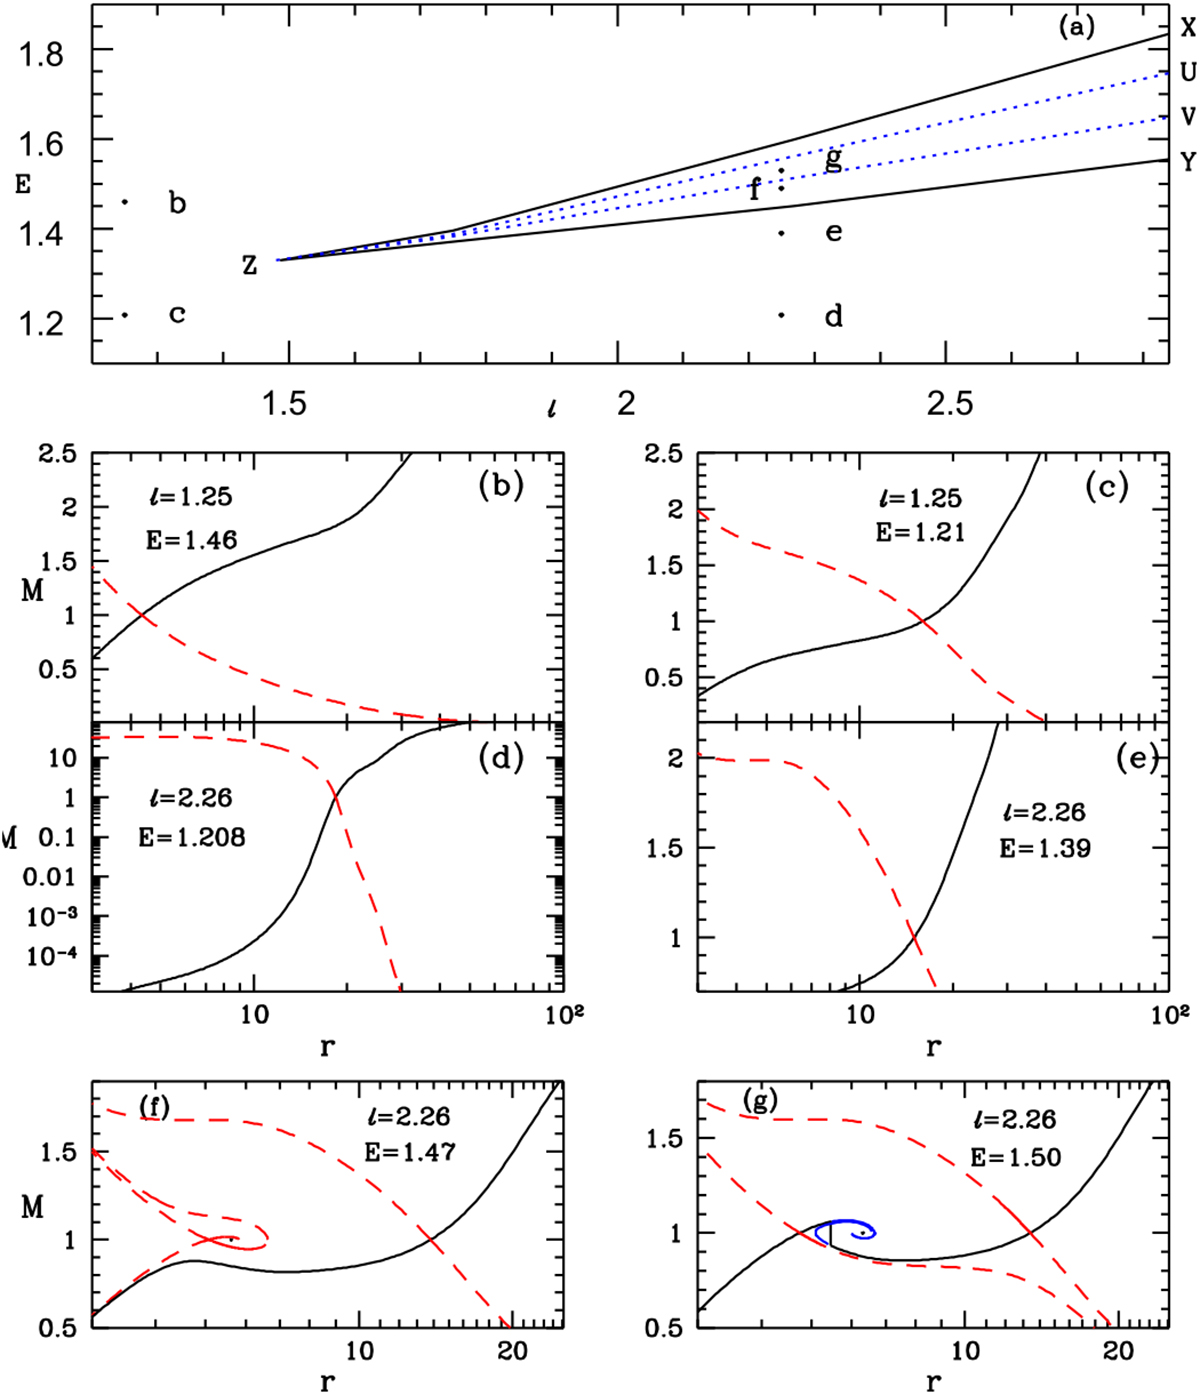
Panel a: E − ℓ parameter space: bounded region XZY signifies parameters for multiple sonic points in jet and region UZV within bluedotted lines represents parameters for which flow goes through shock transition. Filled circles named “b–g” are the flow parameters E and ℓ, for which the jet solutions are plotted in panels b–g. Mach number M = v∕a is plotted as a function of r for b) E = 1.46, ℓ = 1.25; c) E = 1.208, ℓ = 1.25; d) E = 1.208, ℓ = 2.26; e) E = 1.39, ℓ = 2.26; f) E = 1.47, ℓ = 2.26; and g) E = 1.5, ℓ = 2.26. Each panel shows physical jet solutions (solid black line) and corresponding inflow solutions (dashed red line). Sonic points are shown by the crossing of inflow and jet solutions. All solutions are for e − − p + flow.
Current usage metrics show cumulative count of Article Views (full-text article views including HTML views, PDF and ePub downloads, according to the available data) and Abstracts Views on Vision4Press platform.
Data correspond to usage on the plateform after 2015. The current usage metrics is available 48-96 hours after online publication and is updated daily on week days.
Initial download of the metrics may take a while.