Fig. 10
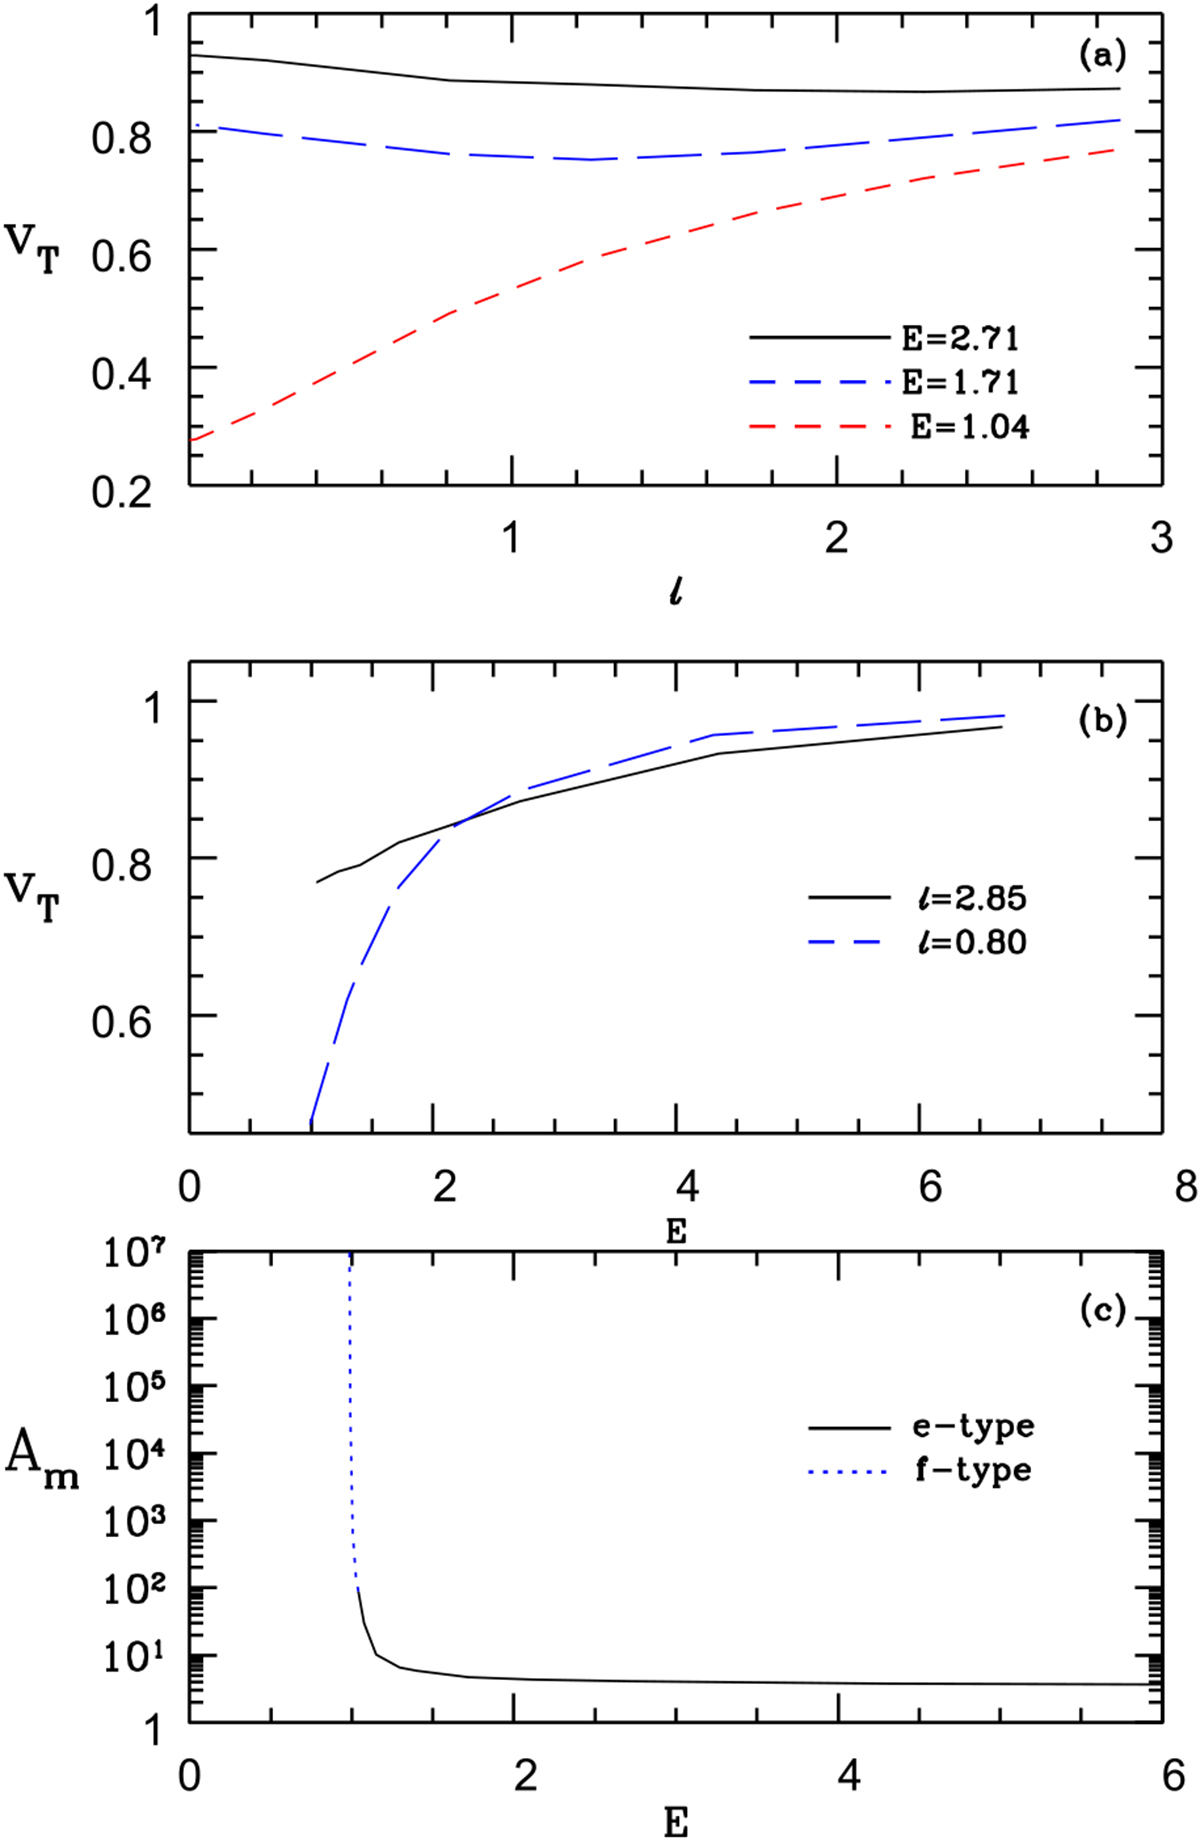
Panel a: variation of vT with ℓ. Various curves represent E = 2.71 (solid black line) E = 1.71 (long dashedblue line) and E = 1.04 (dashed red line). Panel b: vT as a functionof E for different ℓ = 2.85 (solid black line) and 0.8 (dashed red line). Panel c: amplification factor Am with E of jets flowing out through a radiation field of ℓ = 0.8. All panels have ξ = 1. The “e”-type(solid line) and “f”-type (dotted line) jets are also marked.
Current usage metrics show cumulative count of Article Views (full-text article views including HTML views, PDF and ePub downloads, according to the available data) and Abstracts Views on Vision4Press platform.
Data correspond to usage on the plateform after 2015. The current usage metrics is available 48-96 hours after online publication and is updated daily on week days.
Initial download of the metrics may take a while.