Fig. 4
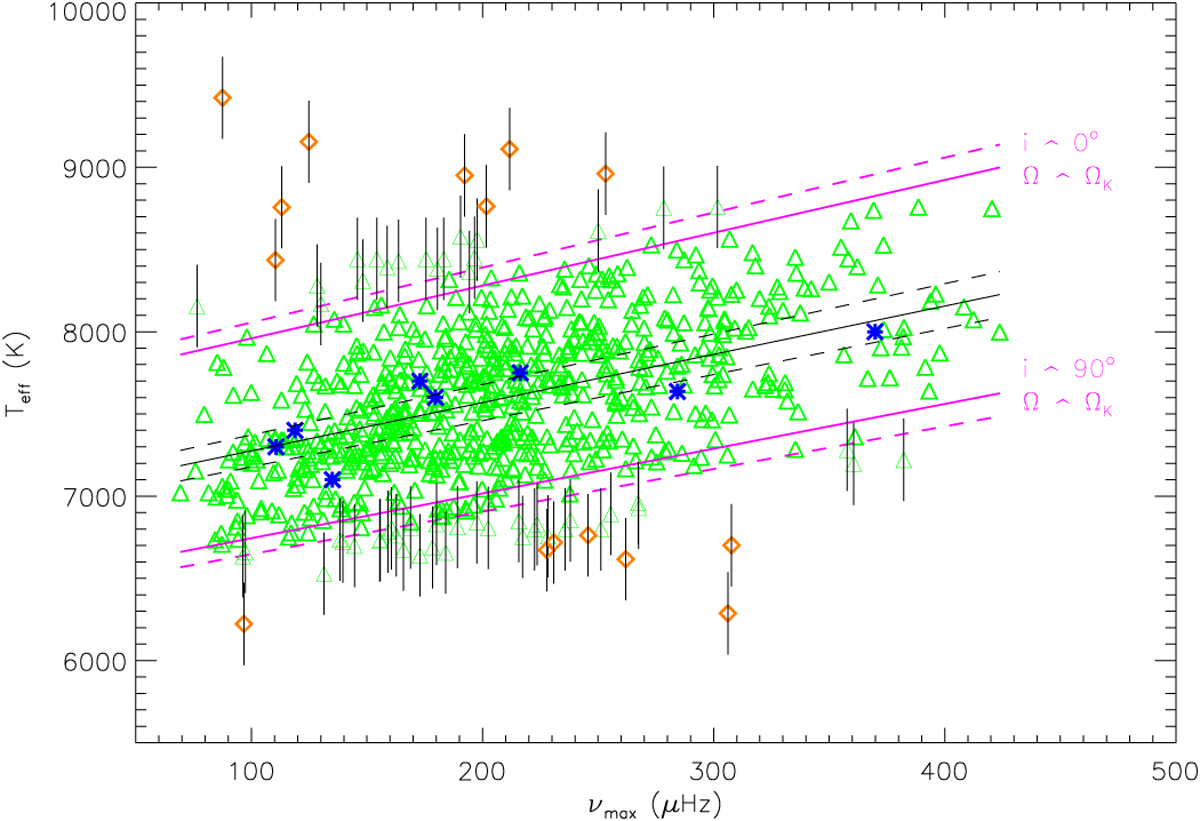
Relation between νmax and ![]() for CoRoT sismo-channel and Kepler δ Scuti stars (blue asterisks, and green triangles, respectively). The black line represents the fitted relation. Purple lines mark the limits of the predicted dispersion due to the gravity-darkening effect. All dashed lines represent the estimated error of the linear fit. Orange diamonds correspond to the 2% of Kepler δ Scuti stars outsidethe limits when taking into account only 1σ error of theirTeff measurement (see text). We show only a few error bars for clarity.
for CoRoT sismo-channel and Kepler δ Scuti stars (blue asterisks, and green triangles, respectively). The black line represents the fitted relation. Purple lines mark the limits of the predicted dispersion due to the gravity-darkening effect. All dashed lines represent the estimated error of the linear fit. Orange diamonds correspond to the 2% of Kepler δ Scuti stars outsidethe limits when taking into account only 1σ error of theirTeff measurement (see text). We show only a few error bars for clarity.
Current usage metrics show cumulative count of Article Views (full-text article views including HTML views, PDF and ePub downloads, according to the available data) and Abstracts Views on Vision4Press platform.
Data correspond to usage on the plateform after 2015. The current usage metrics is available 48-96 hours after online publication and is updated daily on week days.
Initial download of the metrics may take a while.