Fig. 1
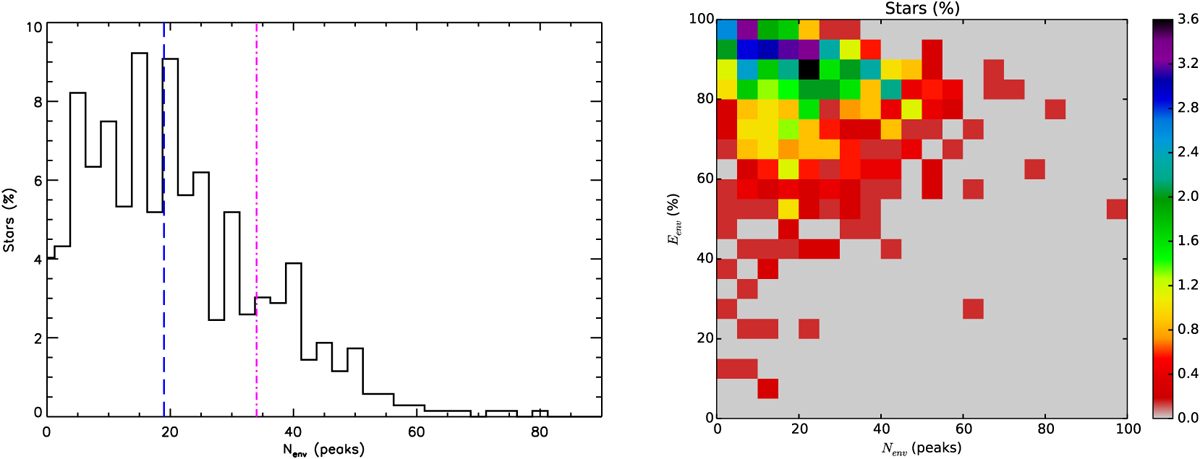
Left panel: distribution of stars according to the number of peaks in their envelope. The mean number of peaks of the envelope (blue dashed line) is similar to the estimate made by Lignières & Georgeot (2009) for a δ Scuti star model rotating at a rate of 0.59 ΩK (purple dash-dotted line). Right panel: distribution of stars according to the number of peaks and the energy of their envelope.
Current usage metrics show cumulative count of Article Views (full-text article views including HTML views, PDF and ePub downloads, according to the available data) and Abstracts Views on Vision4Press platform.
Data correspond to usage on the plateform after 2015. The current usage metrics is available 48-96 hours after online publication and is updated daily on week days.
Initial download of the metrics may take a while.