Fig. 8
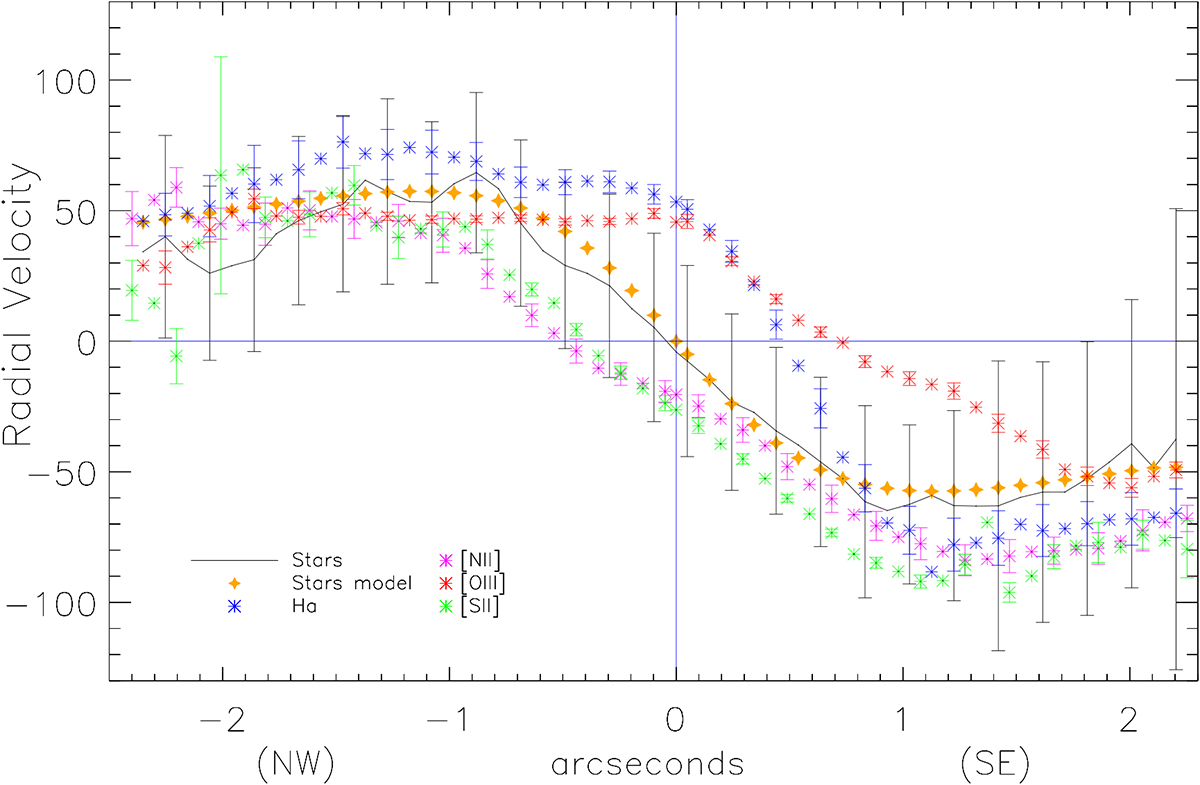
Radial velocity (rotation curves) curves of the emission lines along with the Bertola model (Stars model) for the stellar kinematics, following the legend in the bottom left. The PAs along which these velocities were taken are those derived by Kinemetry (Sect. 3.3) for each emission line: 135° for Hα, 121° for [N II], 137° for [O III] and 113° for [S II]. The zero velocity (horizontal line) corresponds to a (heliocentric) velocity recession of 3731 km s−1. Error bars in the corresponding colour indicate the velocity errors determined by pPXF (stars) or Fluxer (Gaussian fitting to emission lines). The vertical line denotes the position of the continuum peak.
Current usage metrics show cumulative count of Article Views (full-text article views including HTML views, PDF and ePub downloads, according to the available data) and Abstracts Views on Vision4Press platform.
Data correspond to usage on the plateform after 2015. The current usage metrics is available 48-96 hours after online publication and is updated daily on week days.
Initial download of the metrics may take a while.